See exactly what your users do — and why they leave
25 analytics features. One SDK under 5KB. Every question answered in one platform.
Session Replay
Replay any user session in pixel-perfect detail. 44 capture modules record mouse movements, clicks, scrolls, network requests, and console logs — synchronized on a single timeline. See the full context behind every bug, drop-off, and conversion.
Heatmaps
Visualize where users click, move, and scroll on your pages. Overlay real interaction data to identify dead zones and optimize layouts.
Form Analytics
Understand exactly how users interact with your forms. Track field-level engagement, drop-off points, and completion rates.
Error Tracking
Automatically capture JavaScript errors, unhandled promise rejections, and network failures.
Web Vitals
Monitor Core Web Vitals (LCP, CLS, INP) and other performance metrics for every visitor.
Conversion Funnels
Define multi-step conversion funnels and identify exactly where users drop off.
Feedback Widgets
Collect qualitative user feedback with customizable in-app widgets using Shadow DOM isolation.
Privacy by Design
Three consent modes, automatic PII detection, IP anonymization, and data-traceflair-ignore for sensitive elements.
Plugin System
Only ship what you need. Core under 3KB, add capabilities via tree-shakeable plugins.
Bot Detection
Automatically filter out bot traffic, crawlers, and automated scripts.
Realtime Dashboard
See active visitors on your site right now. Live event stream updated every 5 seconds.
Segment Builder
Create custom audience segments by device, country, behavior, or any combination of rules.
Traffic Sources
See where your visitors come from — organic, paid, referral, social, or direct. Track UTM campaigns.
Cohort Analysis
Group users by acquisition date and track how they behave over weeks or months.
Retention Analysis
Measure how many users return after their first visit. Track Day 1, Day 7, and Day 30 retention.
Attribution
Multi-touch attribution models — last click, first click, linear, time decay. Know which channels drive revenue.
A/B Testing
Run experiments with traffic splitting, goal tracking, and statistical significance calculations.
E-Commerce Analytics
Track revenue, transactions, average order value, cart abandonment, and product performance.
Data Export
Export events and sessions as CSV, JSON, or NDJSON. Your data, your way — no vendor lock-in.
Ad Cost Import
Import ad spend from Google Ads, Meta, and more. Calculate true ROAS and CPA across campaigns.
Engagement Analytics
Attention scores, rage clicks, dead clicks — understand how engaged your users really are.
Network Analytics
Monitor API performance — response times, error rates, and request volume per endpoint.
Navigation Flow
Visualize user journeys — page transitions, top paths, and entry/exit points across your site.
Compliance Dashboard
GDPR/ePrivacy audit scores, cookie tracking, third-party script detection, and compliance history.
Technology Insights
Browser, OS, device type, and screen resolution breakdown for every visitor.
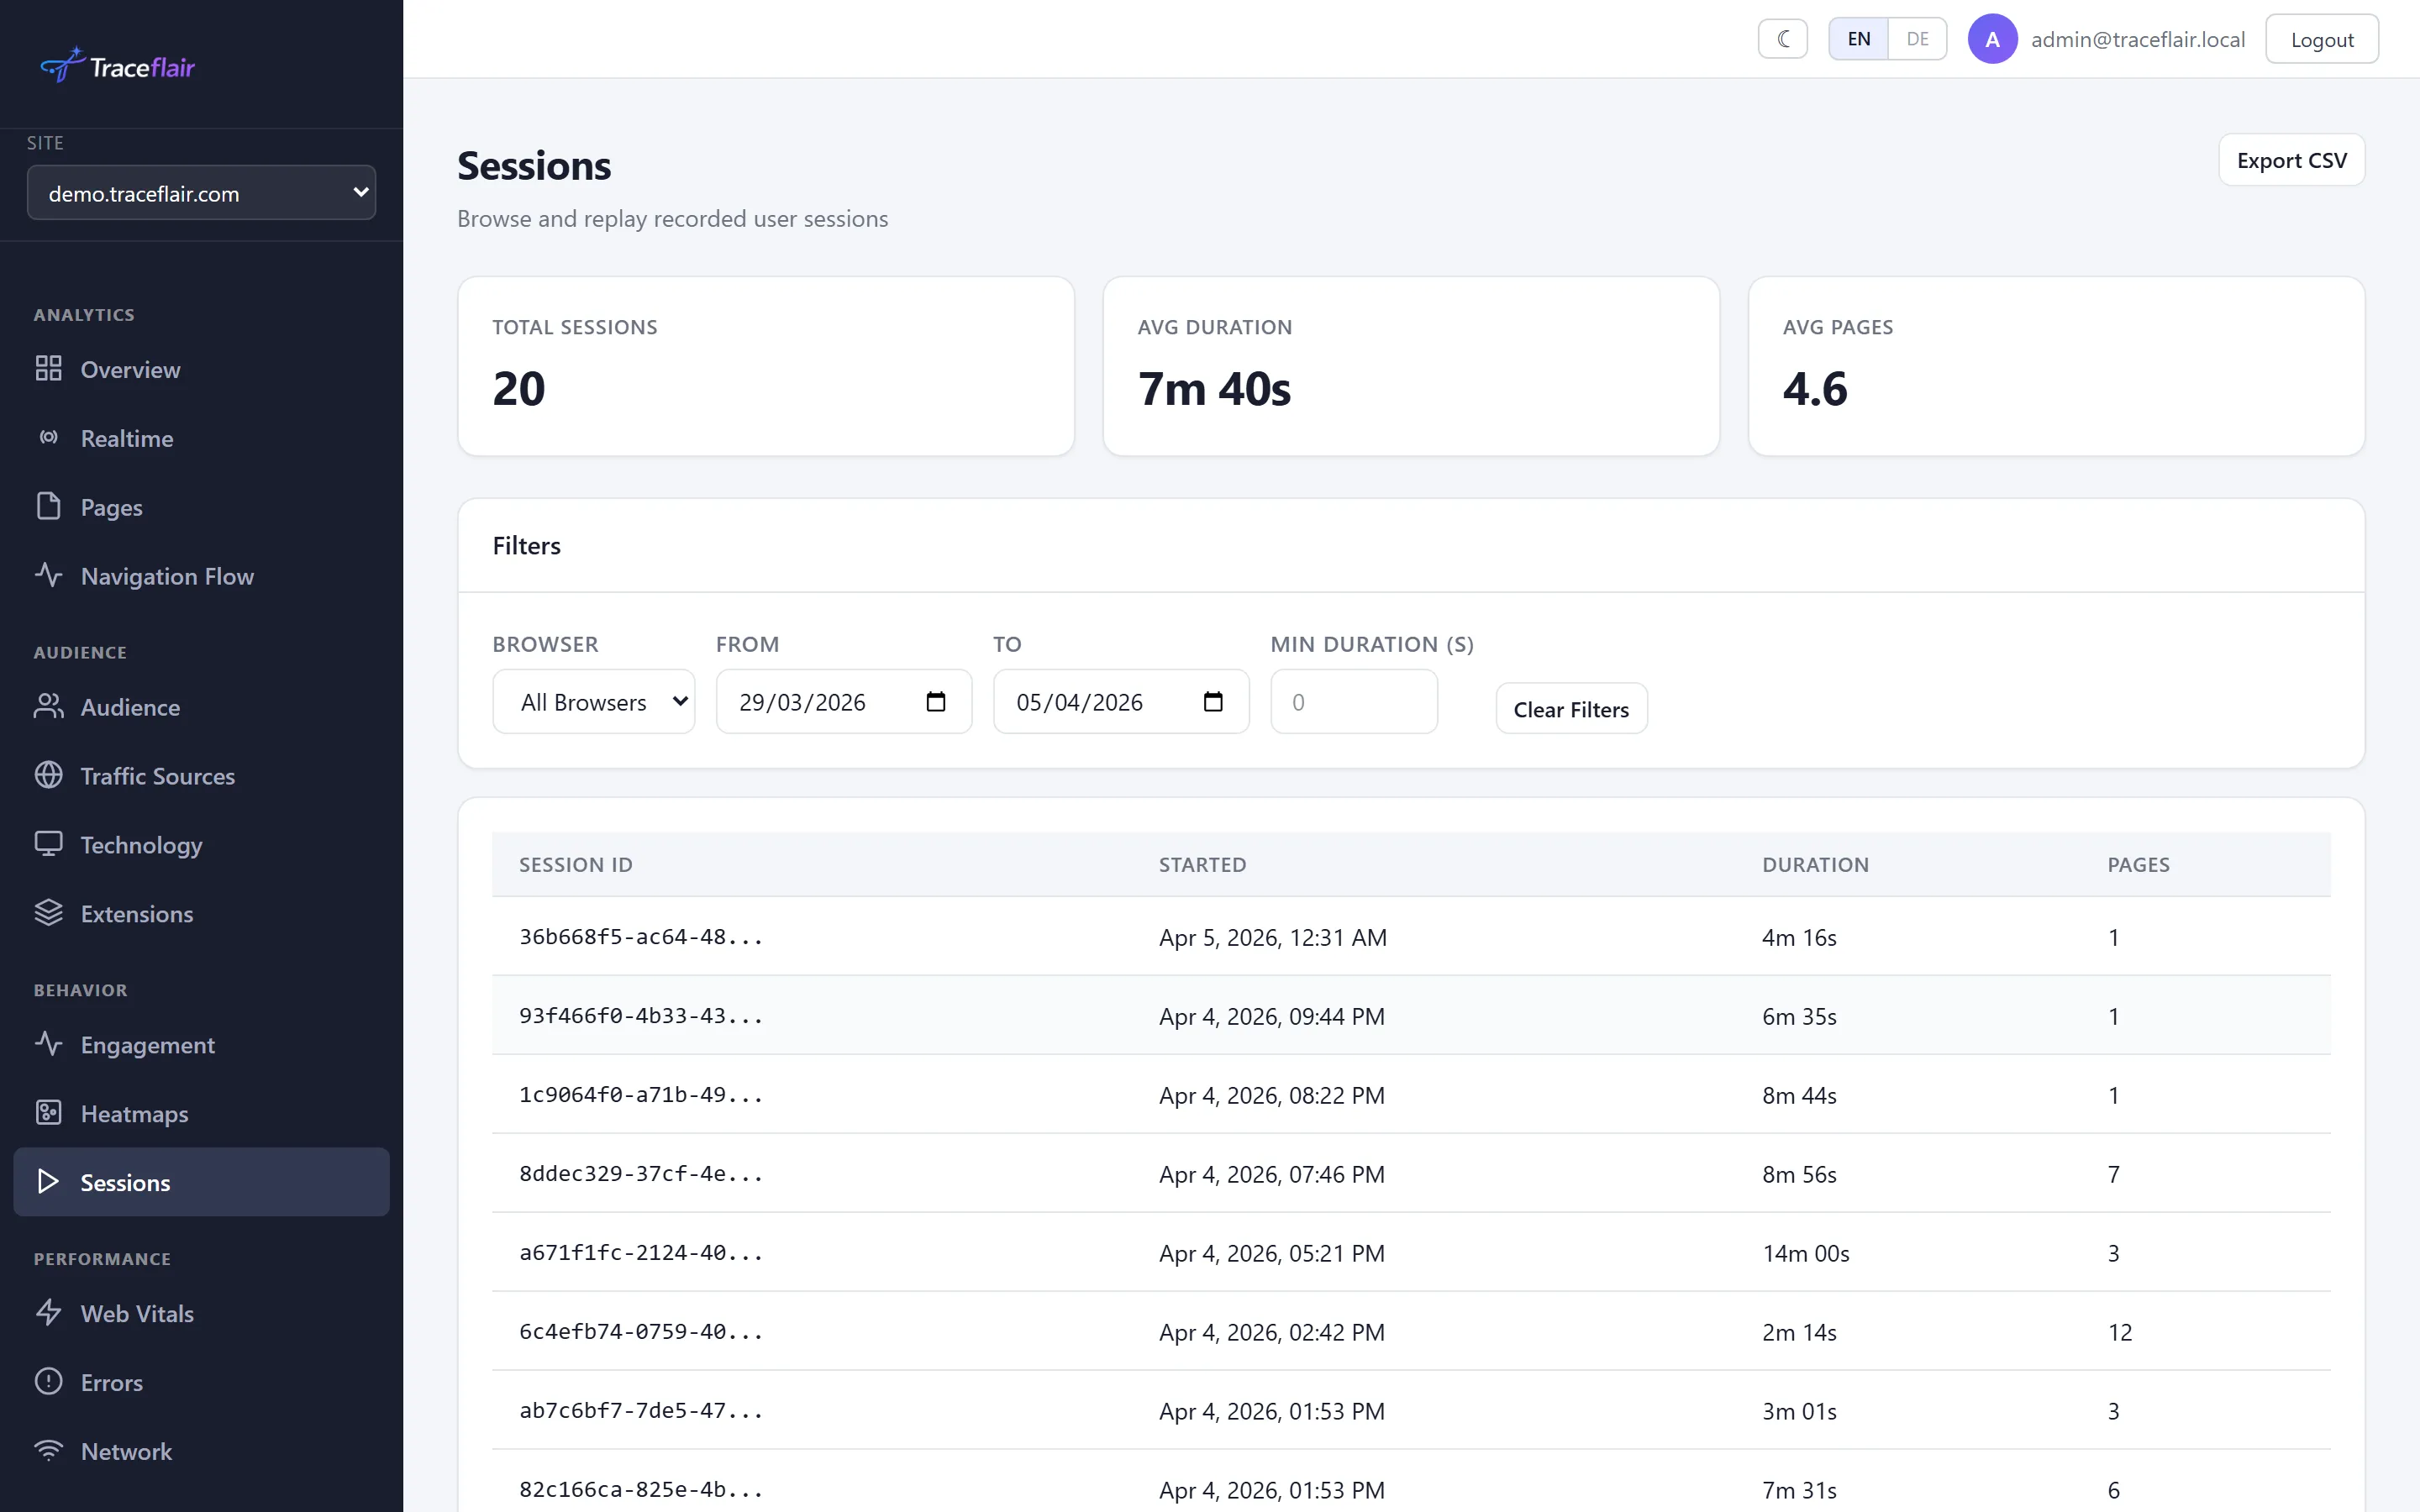
Session Replay
Replay any user session in pixel-perfect detail. 44 capture modules record mouse movements, clicks, scrolls, network requests, and console logs — synchronized on a single timeline. See the full context behind every bug, drop-off, and conversion.
- DOM mutation tracking with MutationObserver
- Input masking for privacy (PII protection)
- Network request & response capture
- Console log recording
- Device orientation & touch events
Heatmaps
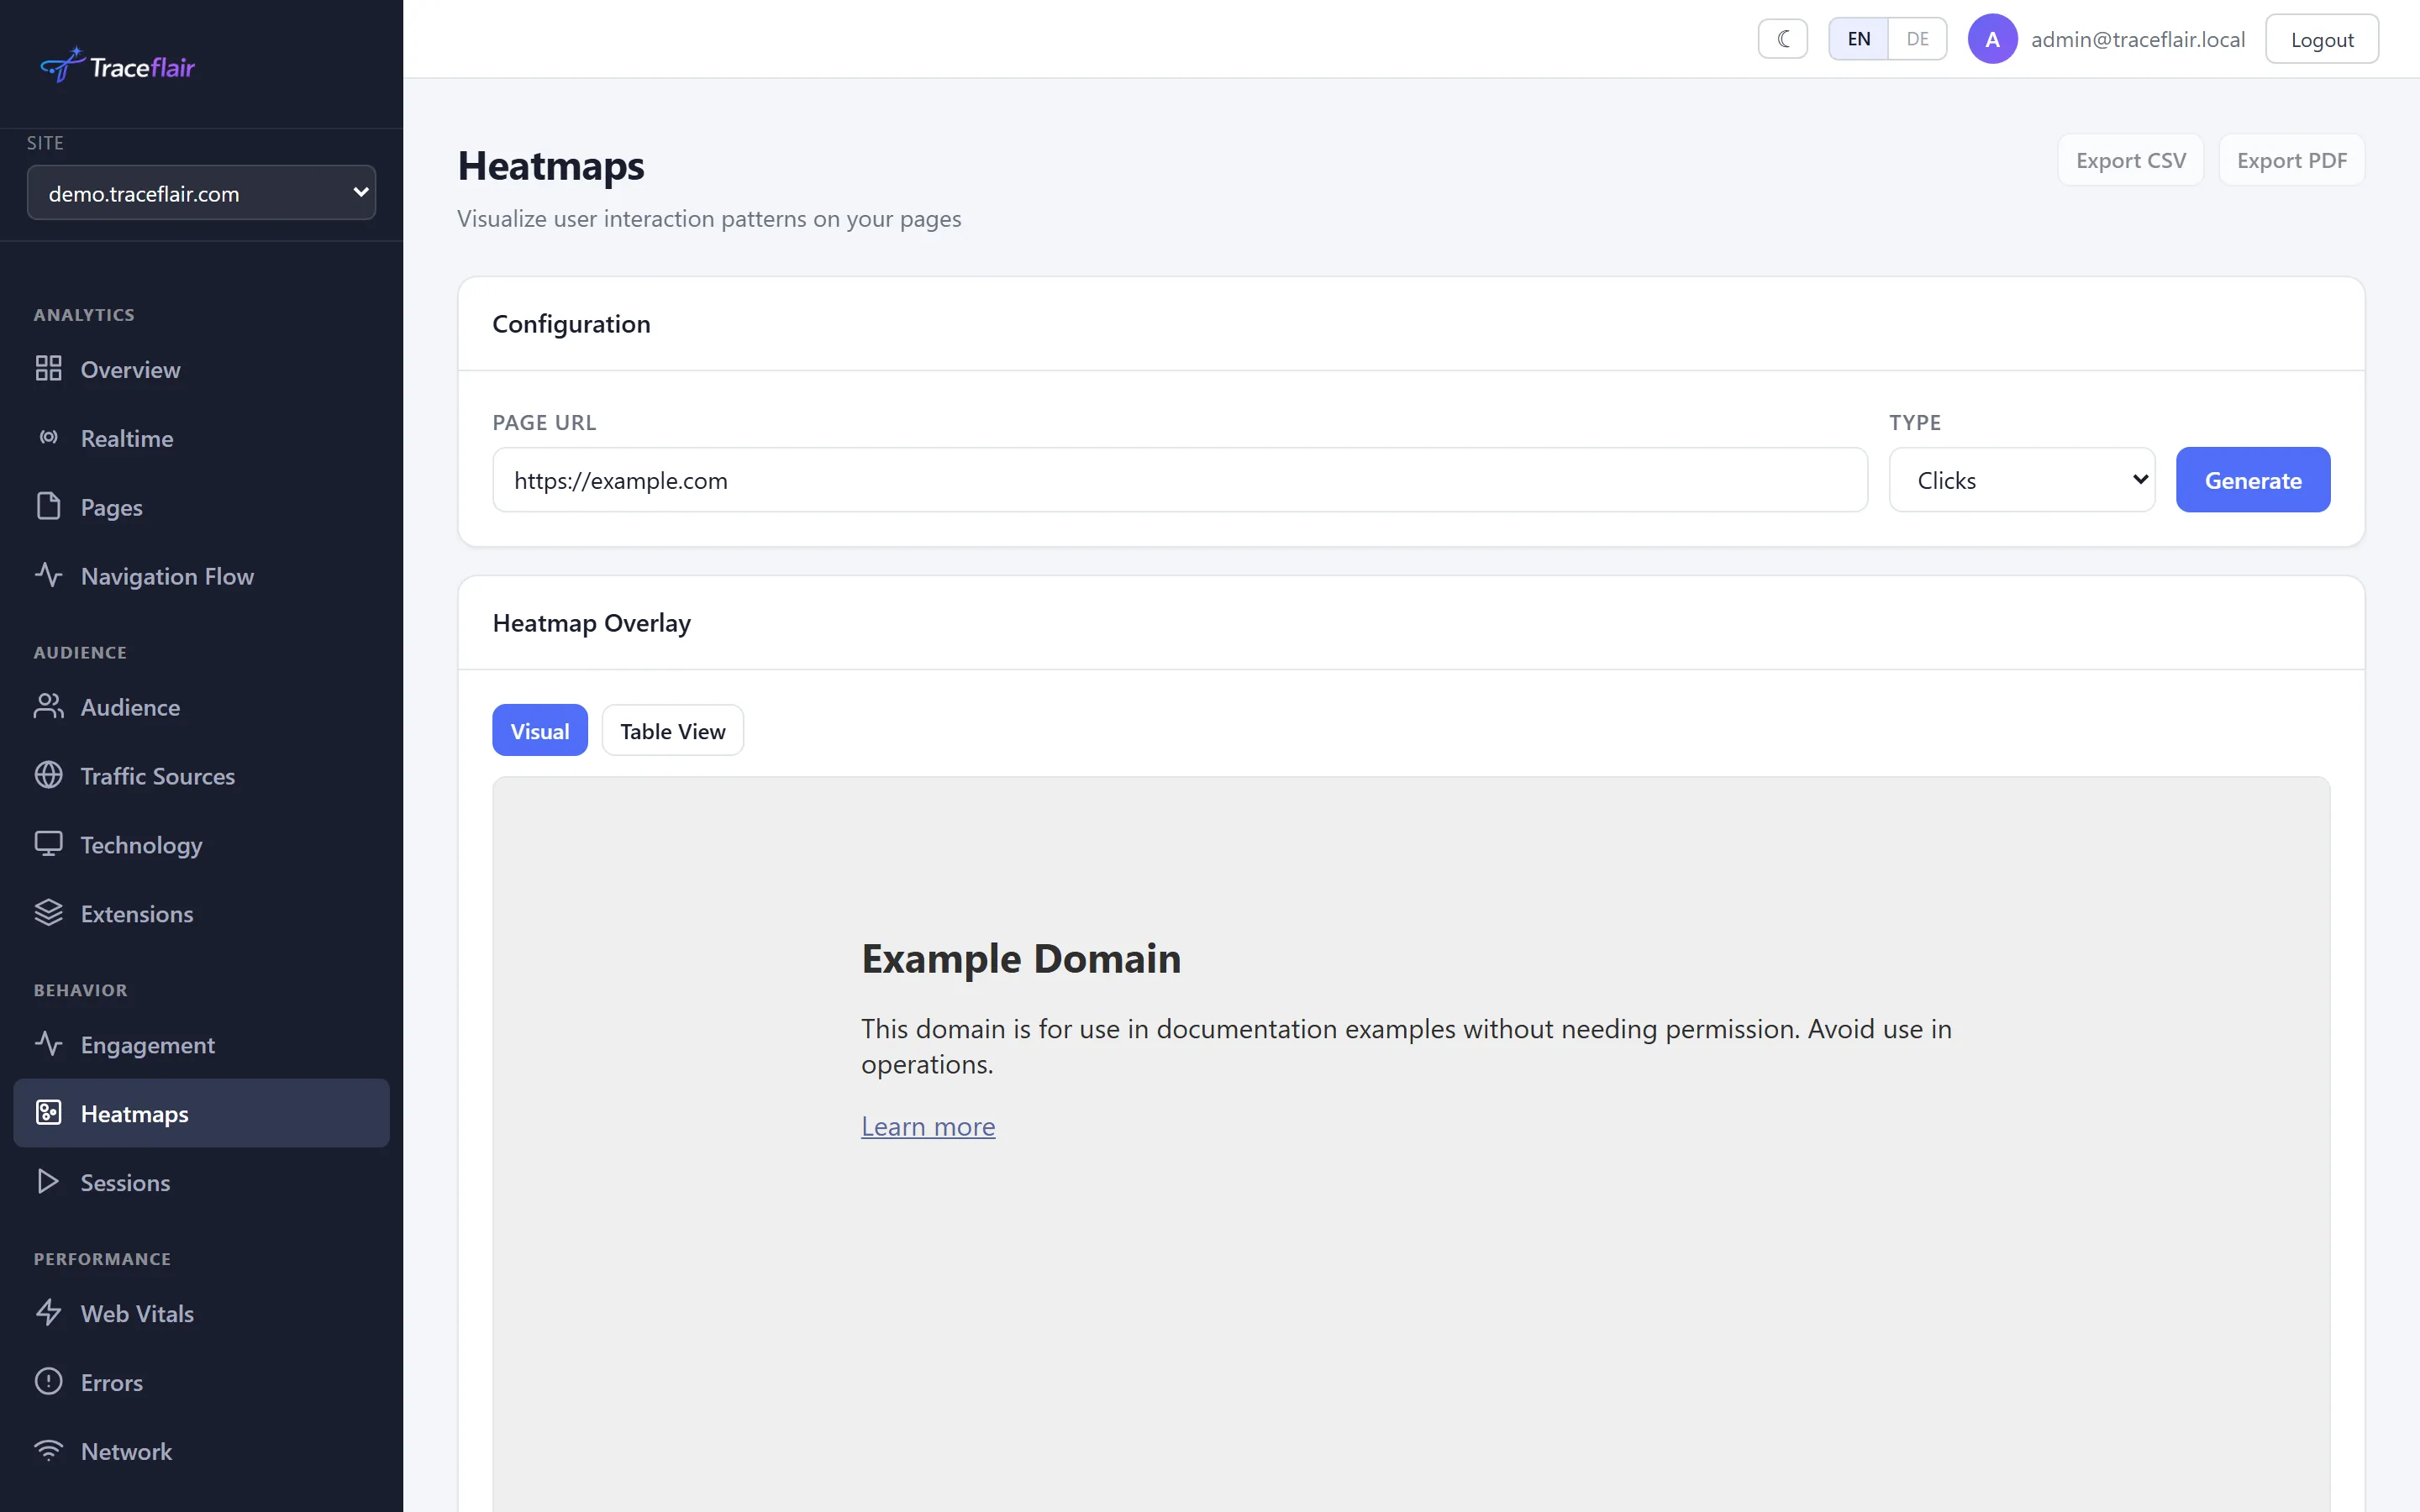
Visualize where users click, move, and scroll on your pages. Overlay real interaction data to identify dead zones, popular areas, and optimize your layouts for conversion.
- Click, move, and scroll heatmaps
- Rage click & dead click detection
- Responsive viewport filtering
- Export as image or data
Form Analytics
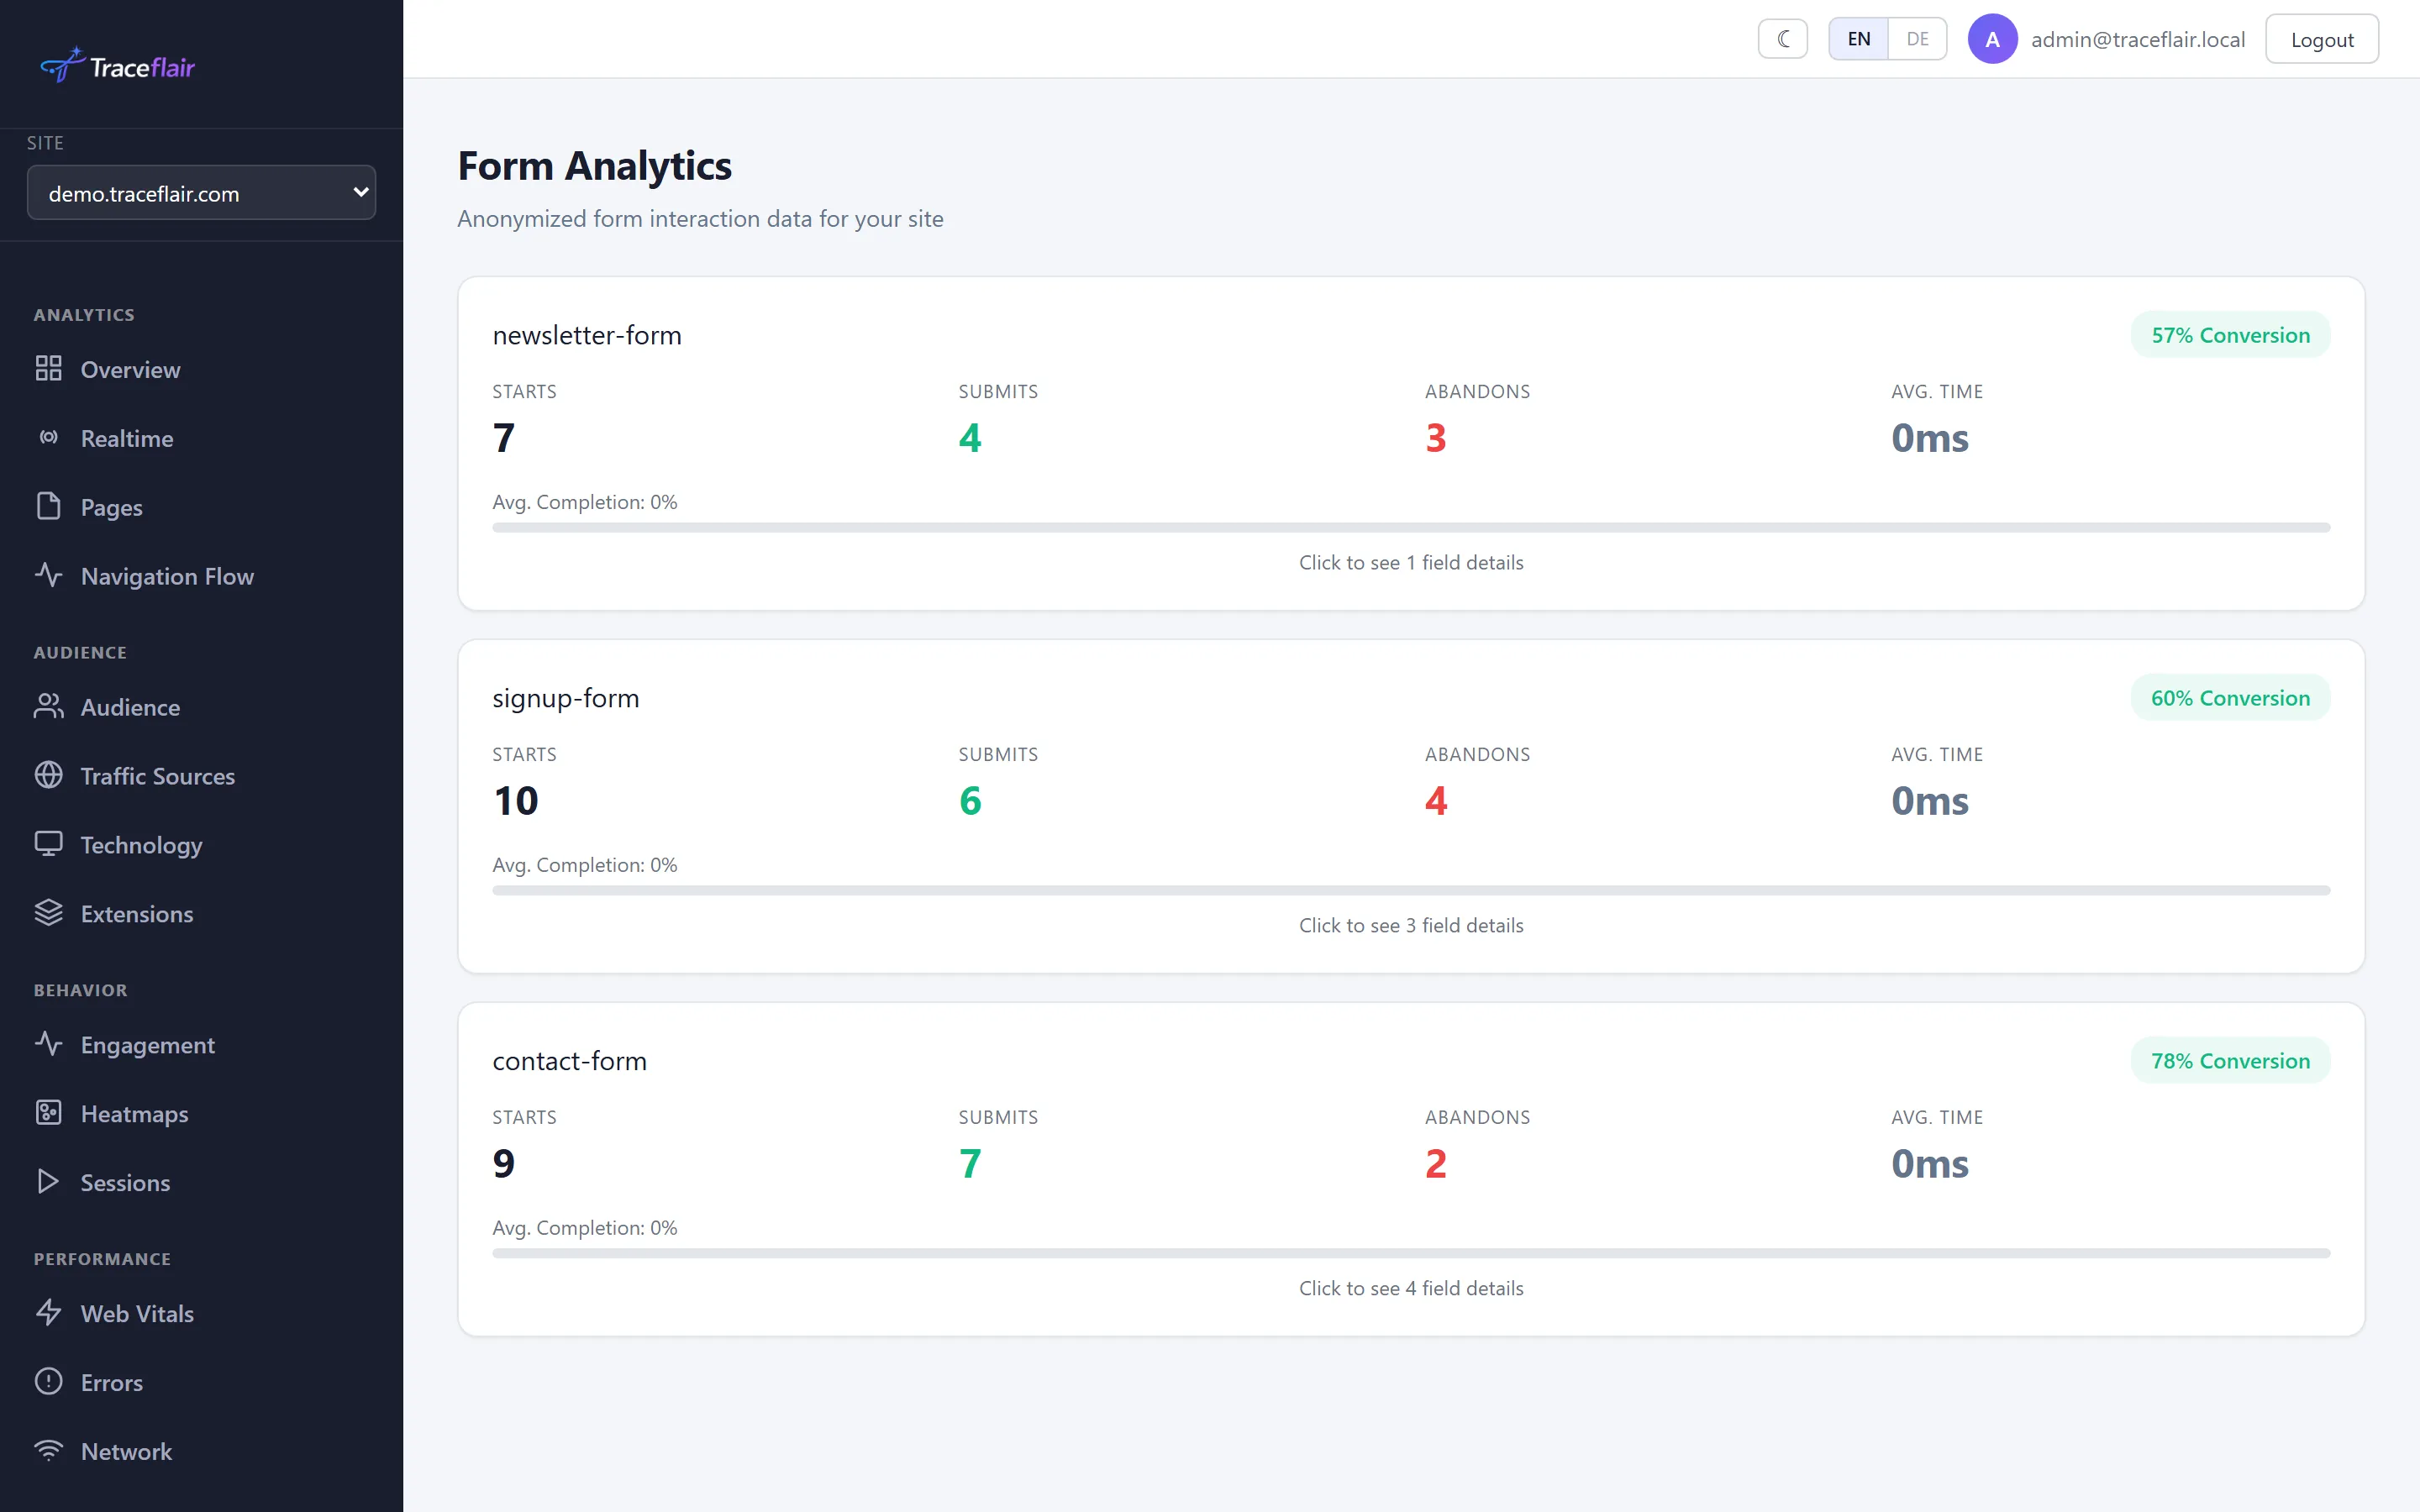
Understand exactly how users interact with your forms. Track field-level engagement, drop-off points, hesitation time, and completion rates to fix the fields that lose you conversions.
- Field-level interaction tracking
- Abandonment funnel per form
- Hesitation & correction detection
- Completion rate by field
Error Tracking
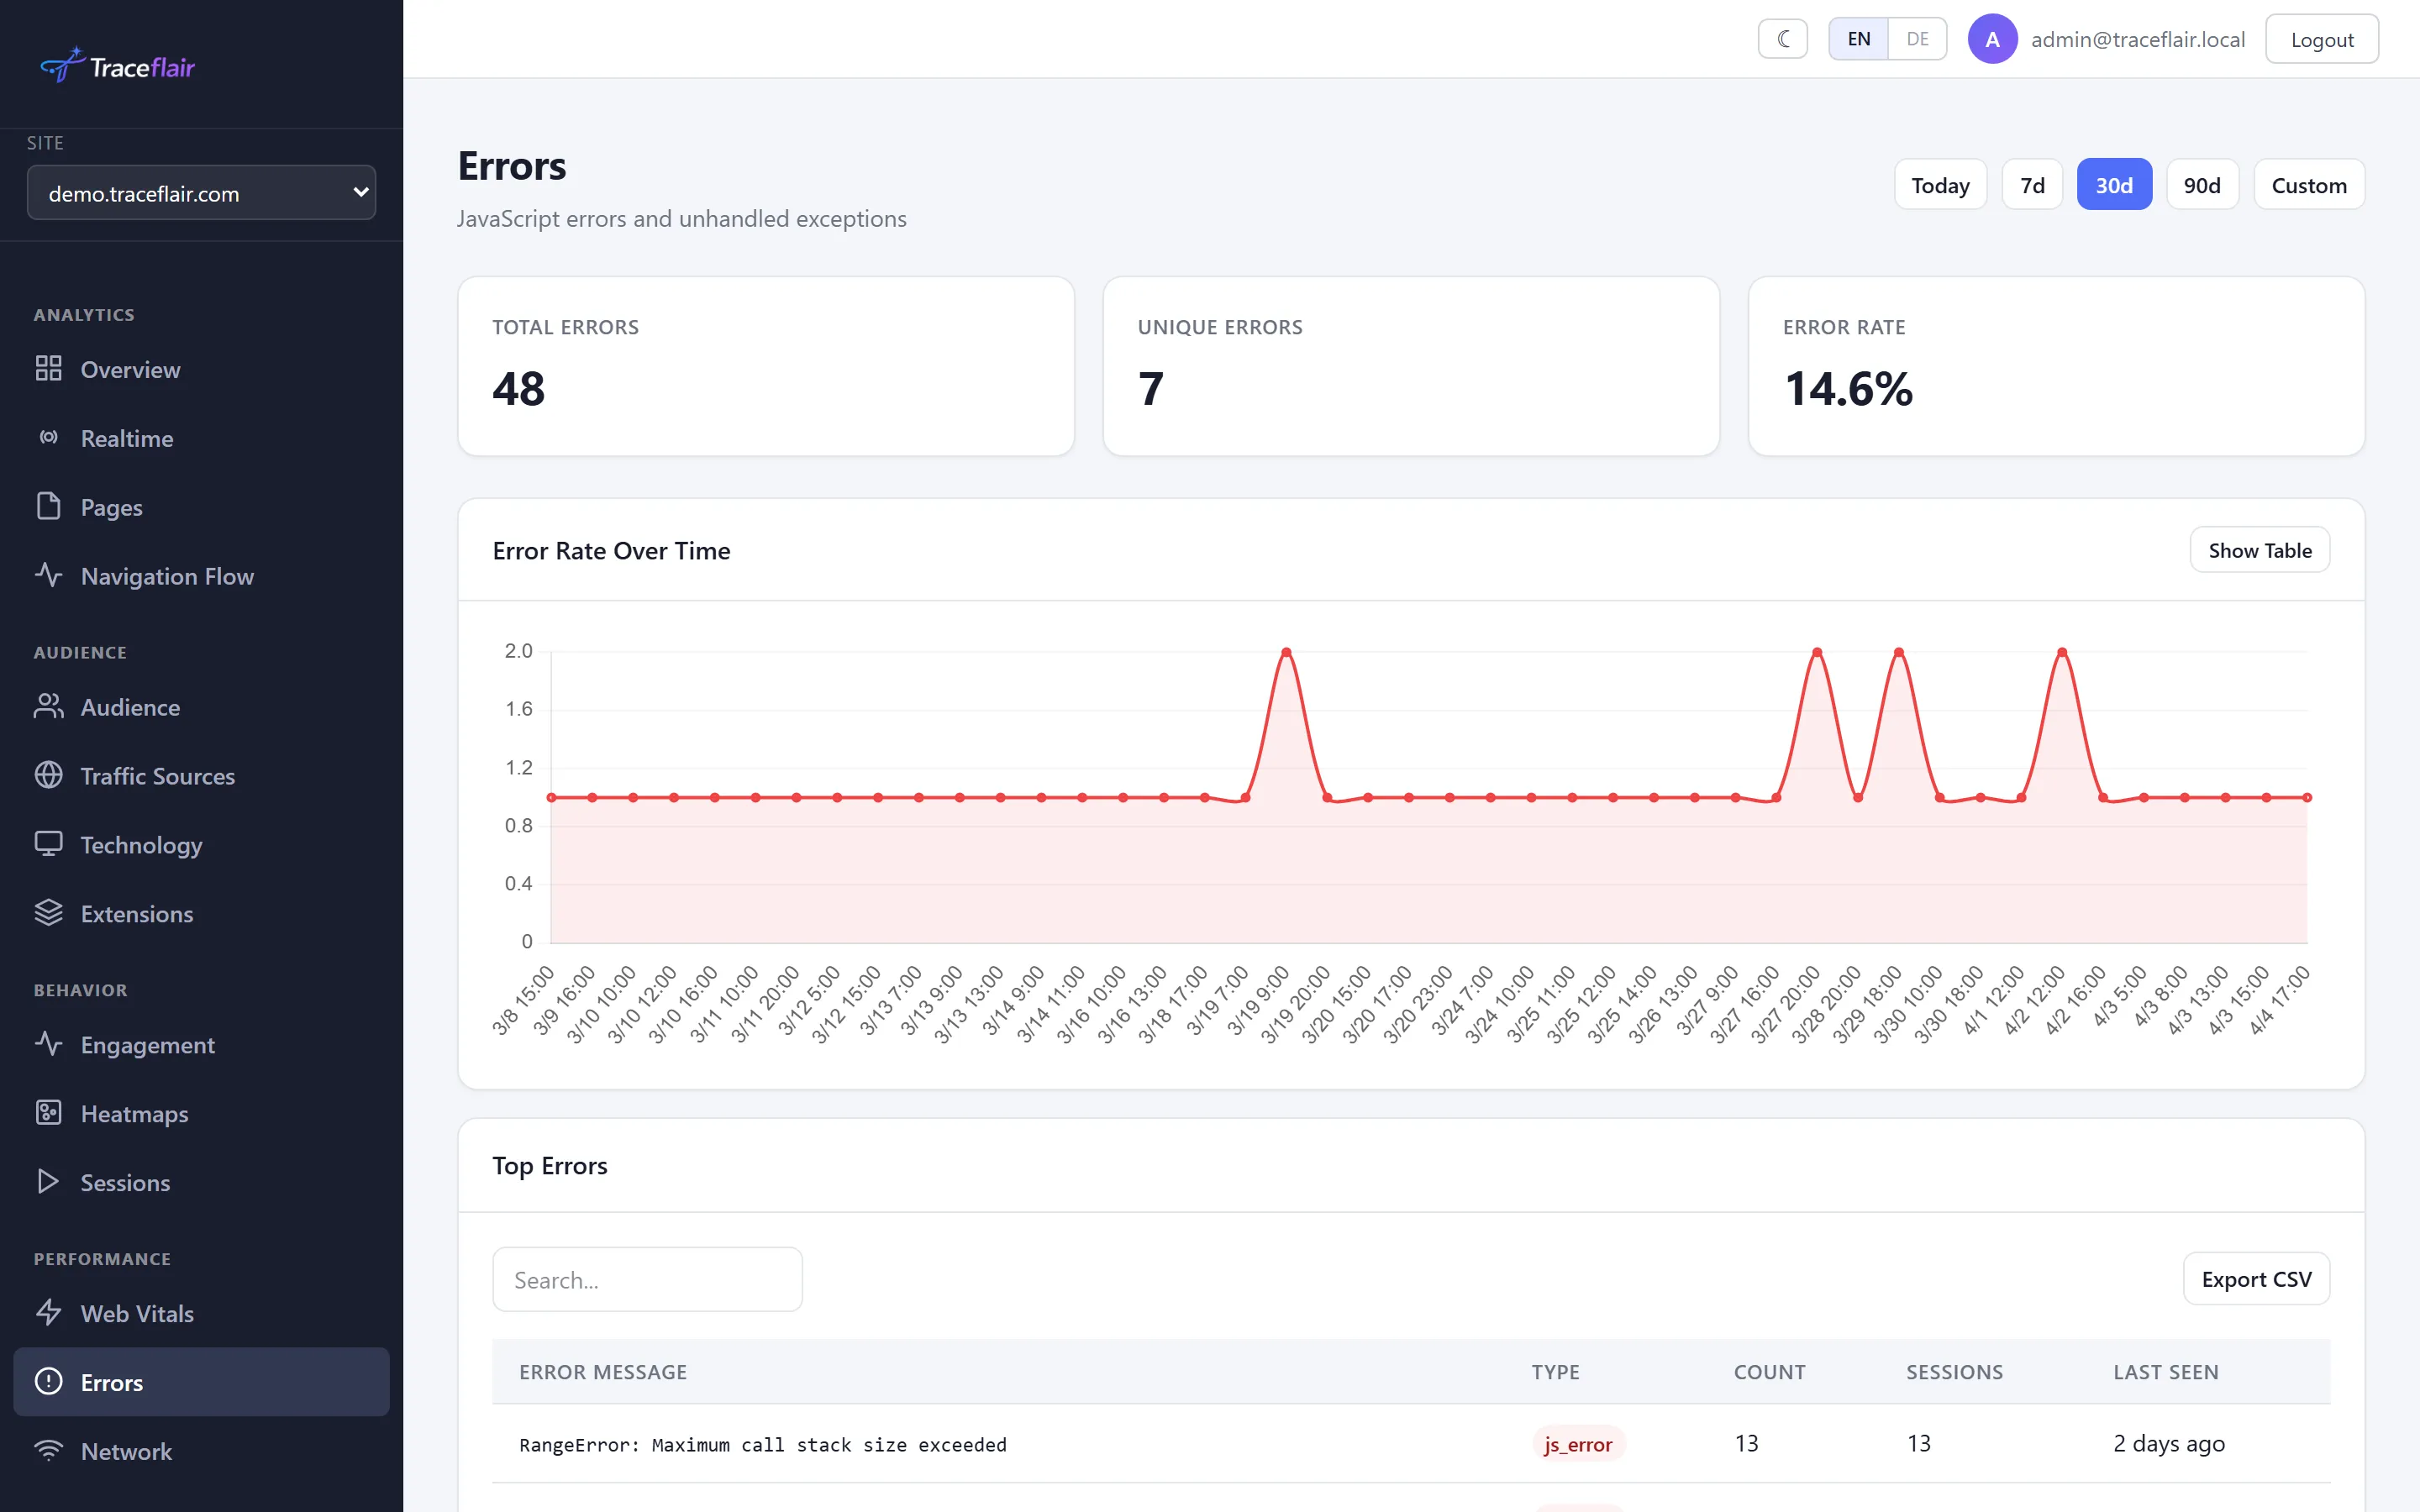
Automatically capture JavaScript errors, unhandled promise rejections, and network failures. See the exact session replay leading up to each error for faster debugging.
- Automatic JS error capture with stack traces
- Linked session replay for each error
- Error grouping and trend analysis
- Network error monitoring
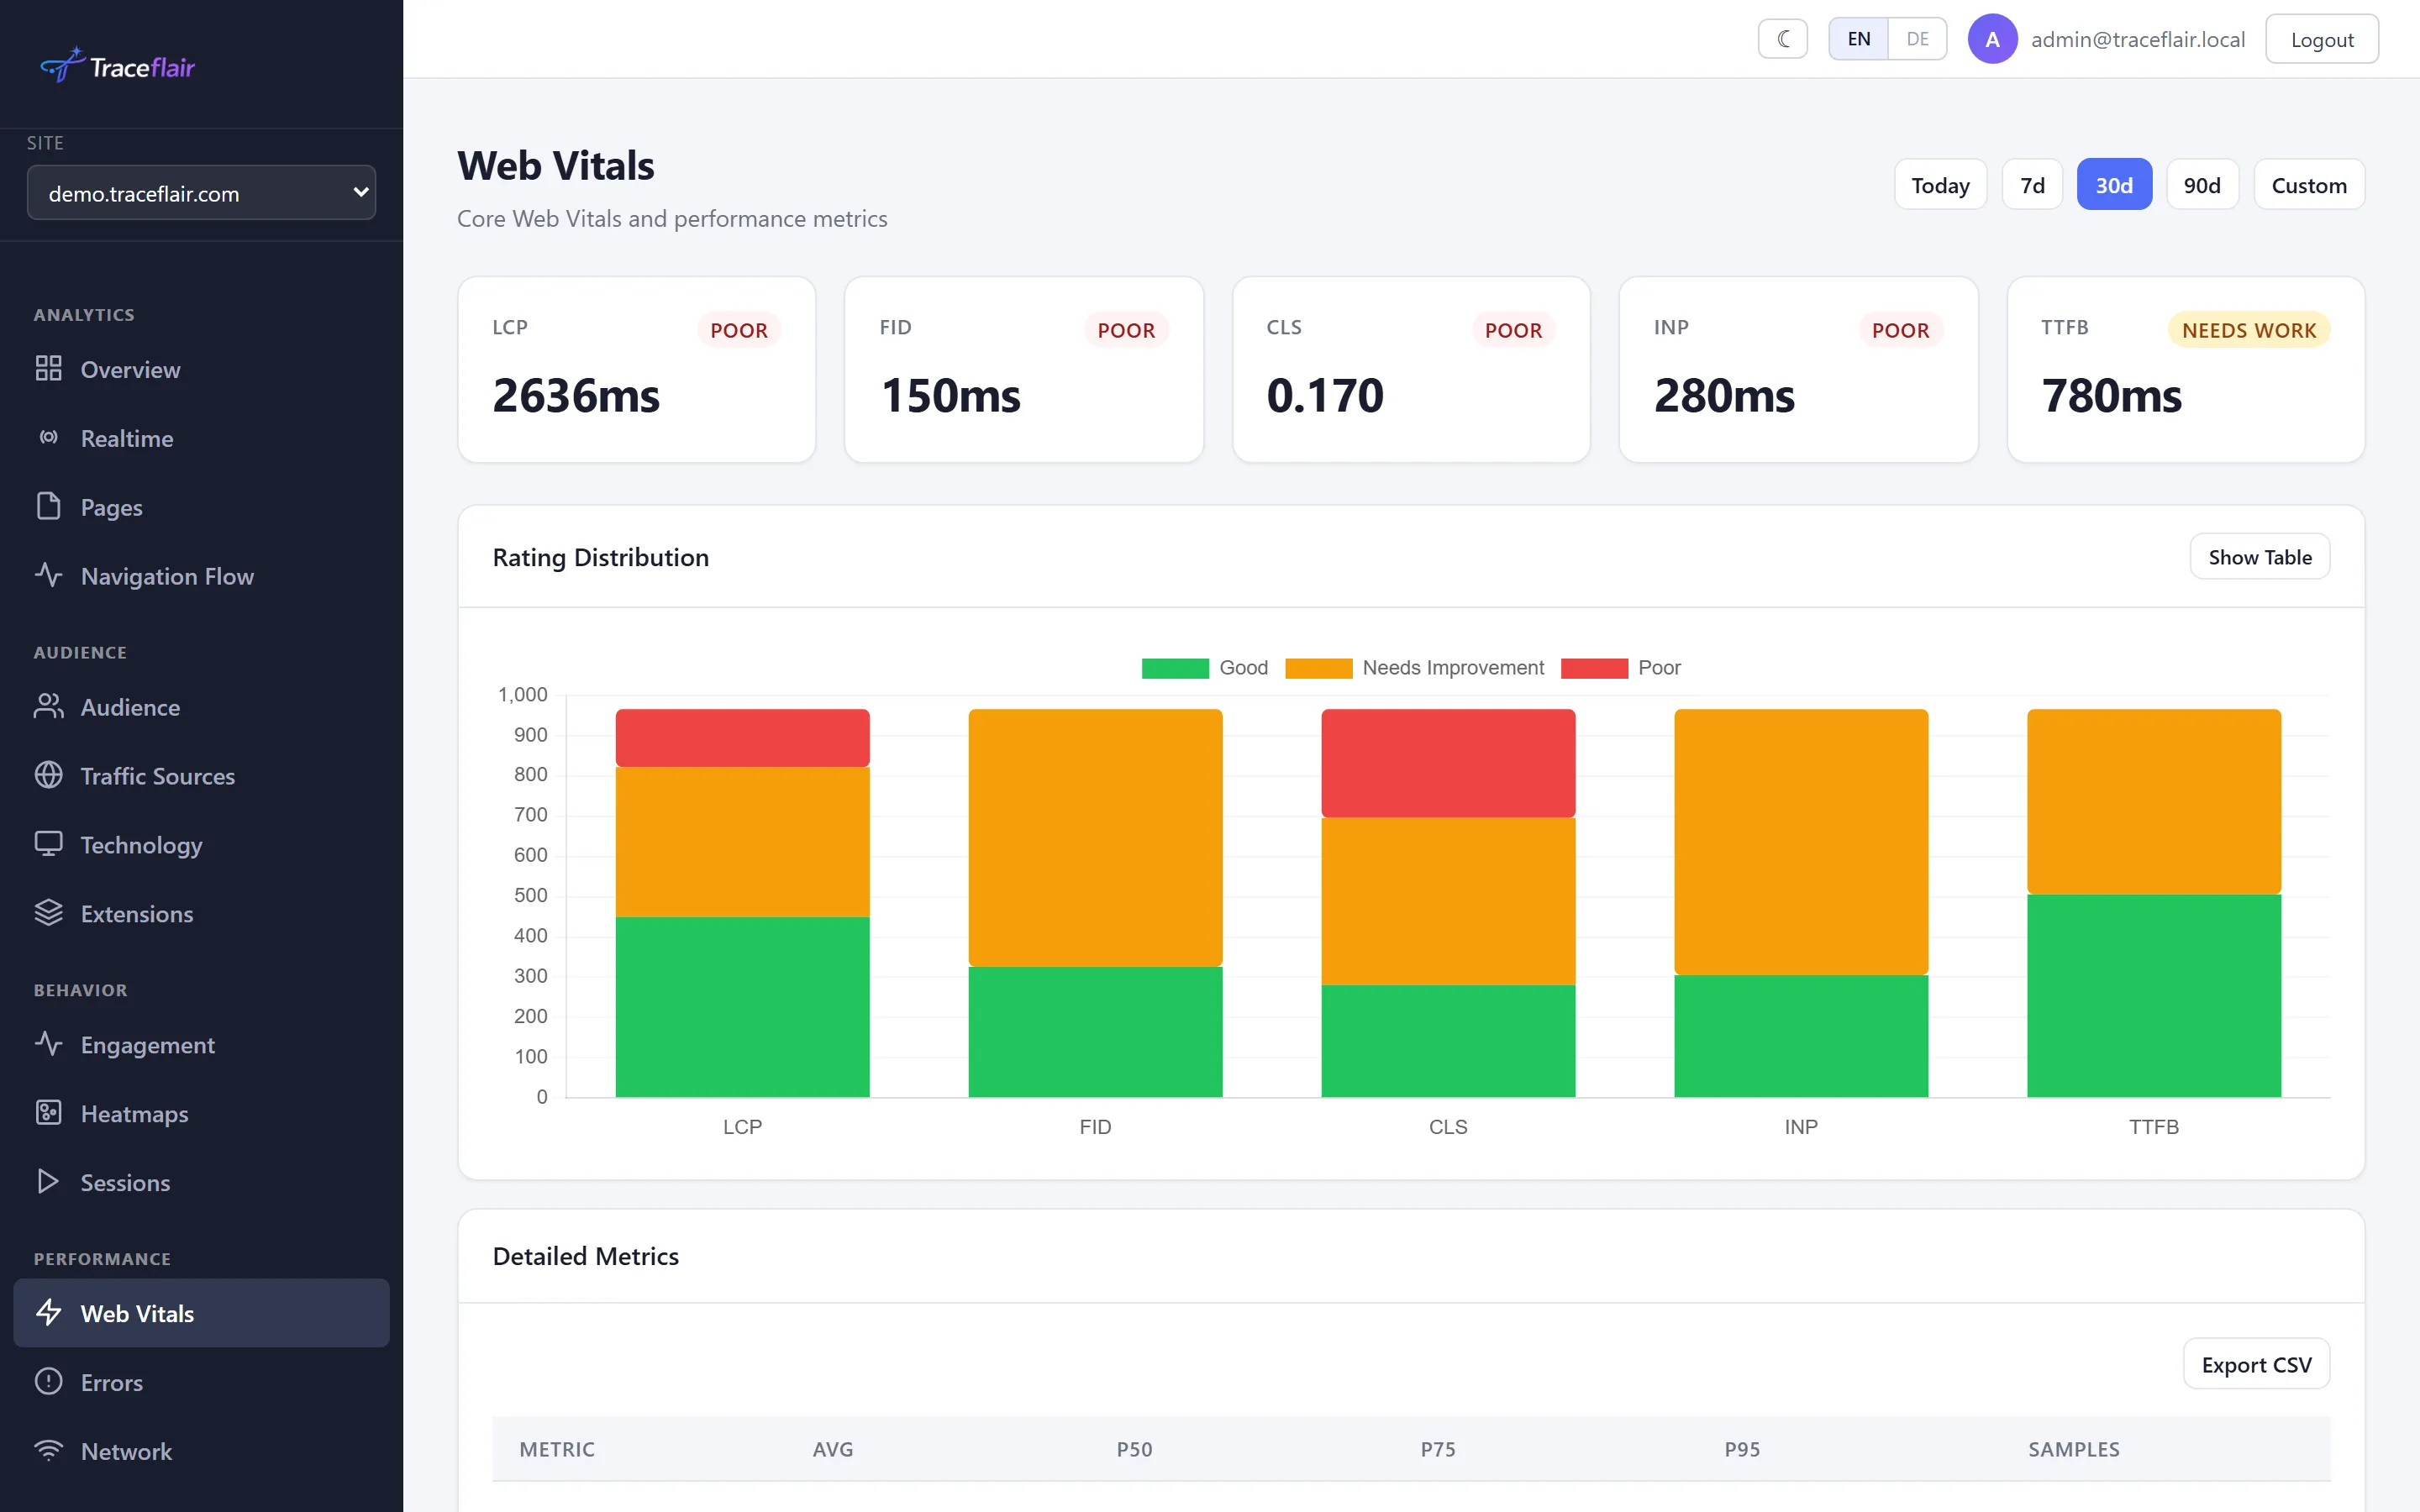
Web Vitals
Monitor Core Web Vitals (LCP, CLS, INP) and other performance metrics for every visitor. Track trends over time and get alerted when performance degrades.
- LCP, CLS, INP, FCP, TTFB tracking
- Real user monitoring (RUM)
- Historical trends and alerts
- Performance by device and connection
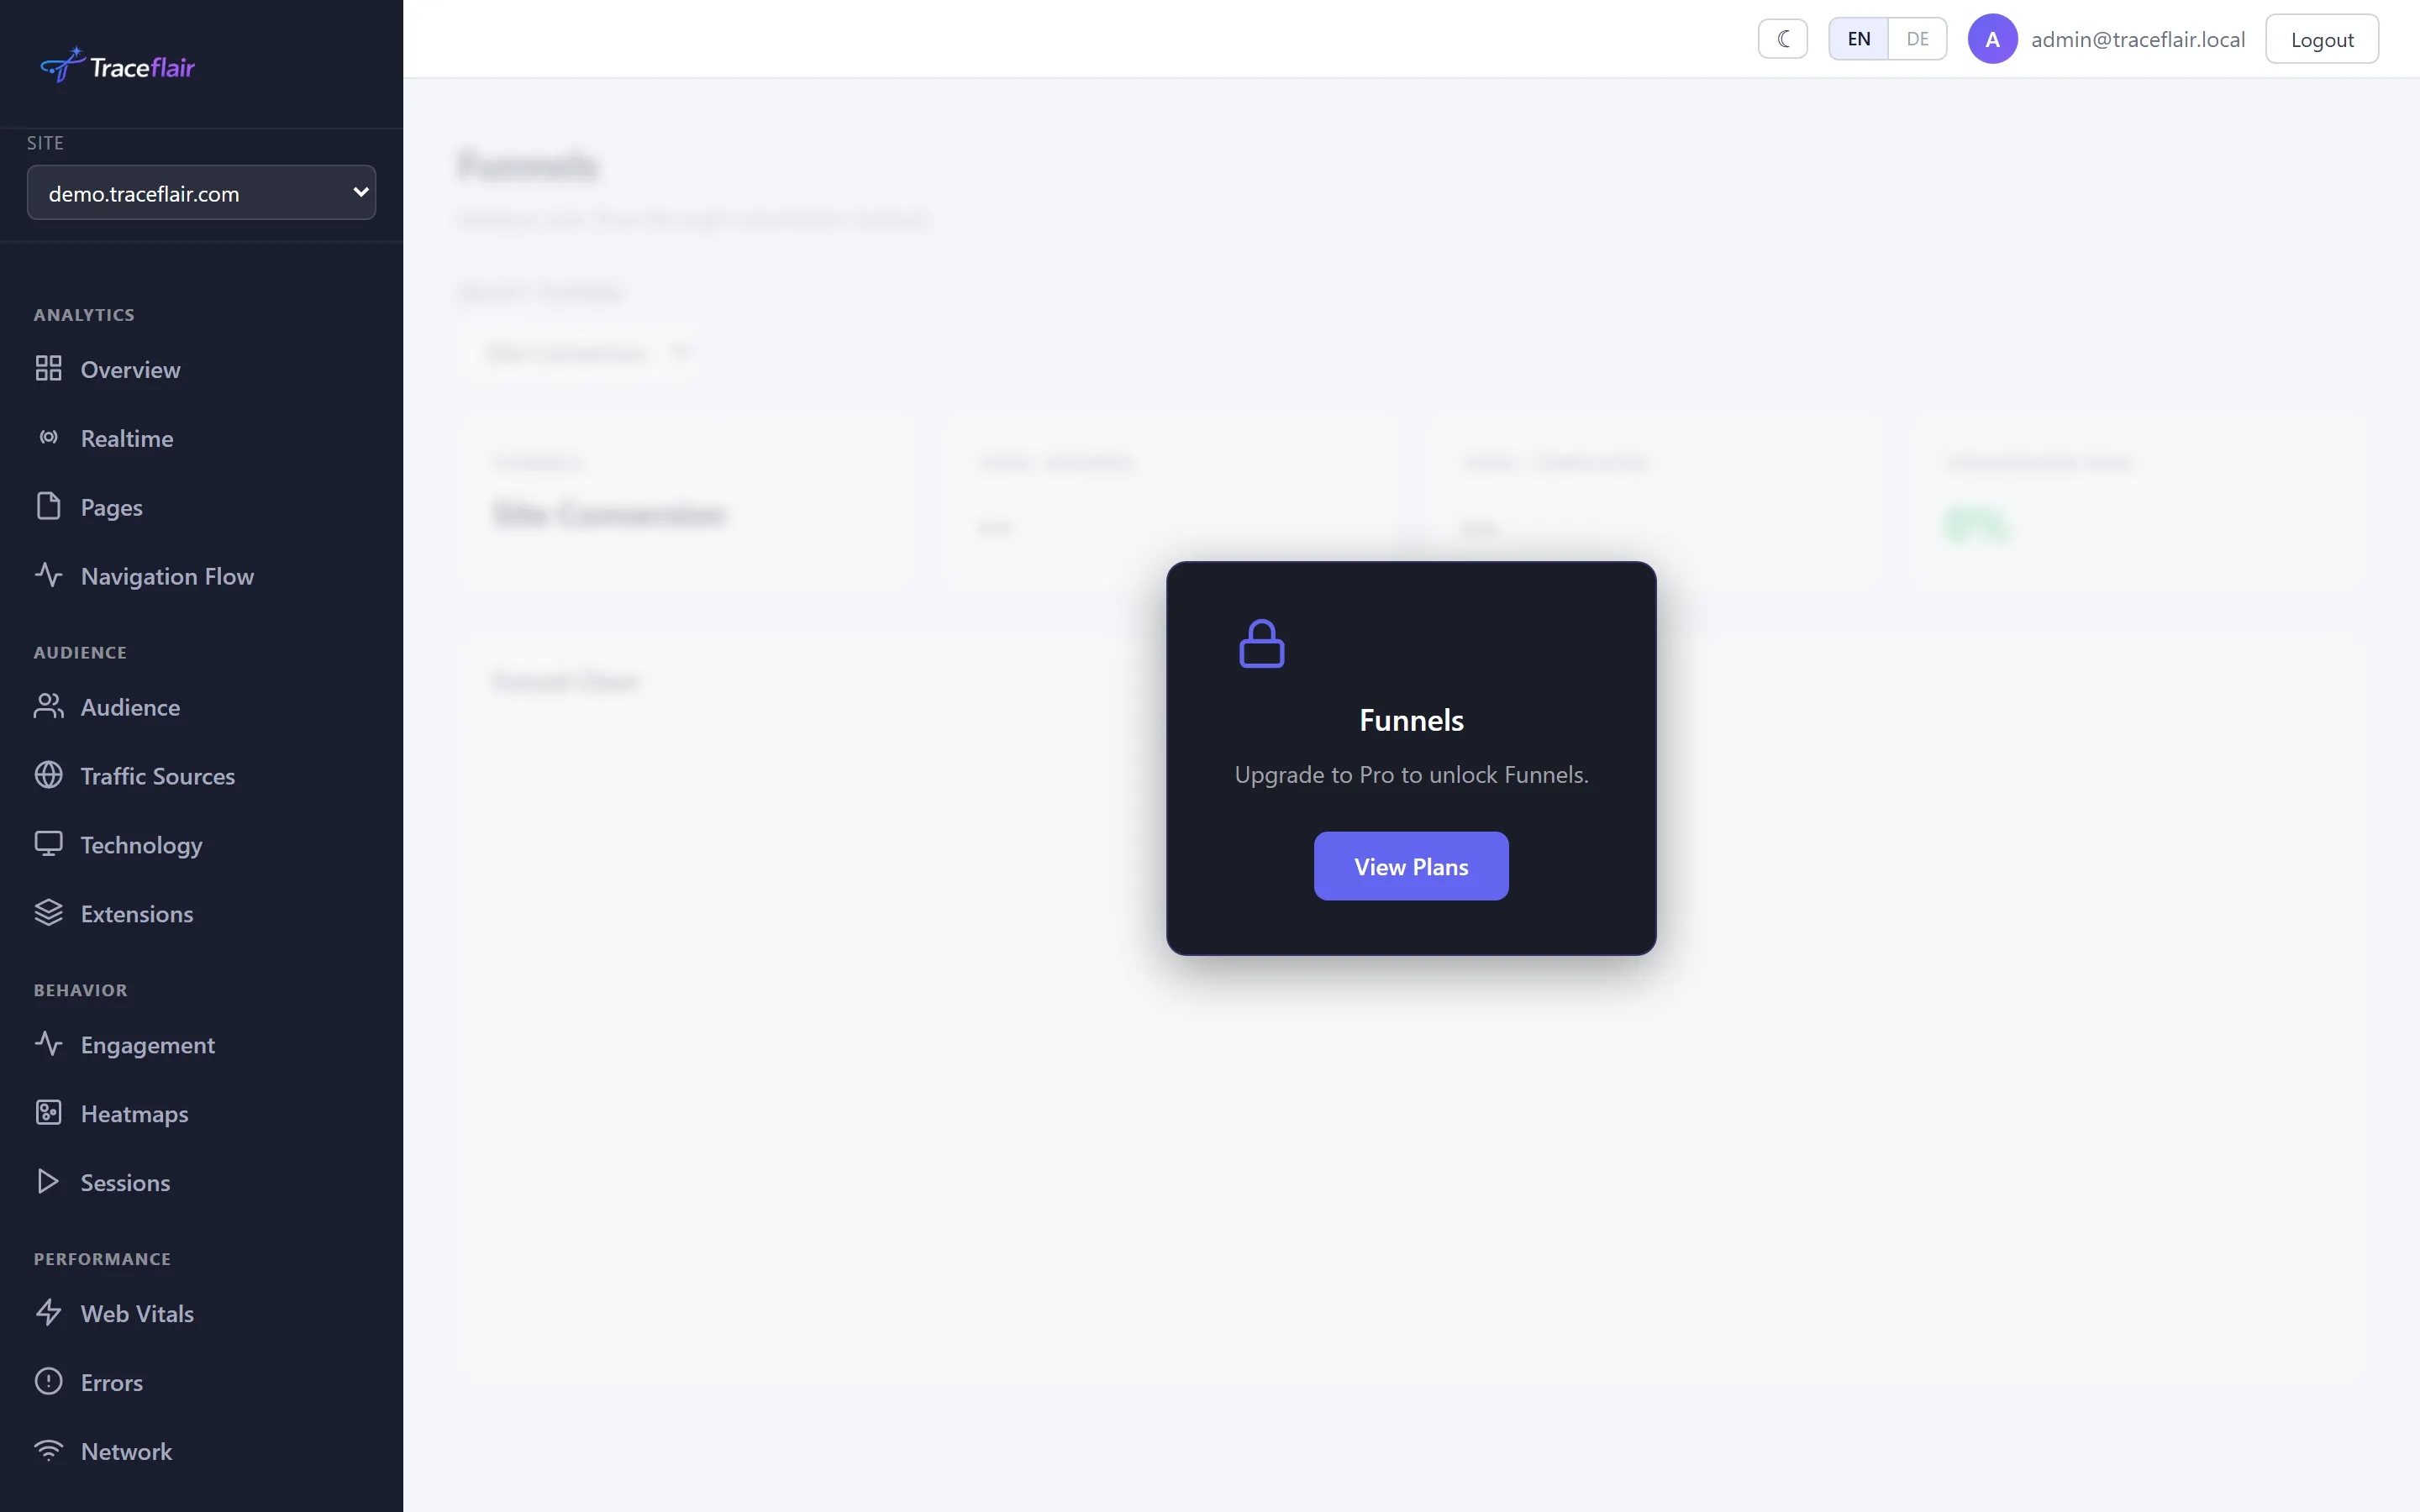
Conversion Funnels
Define multi-step conversion funnels and identify exactly where users drop off. Compare funnel performance across segments, time periods, and A/B tests.
- Multi-step funnel definition
- Drop-off analysis per step
- Segment comparison
- Time-based funnel trends
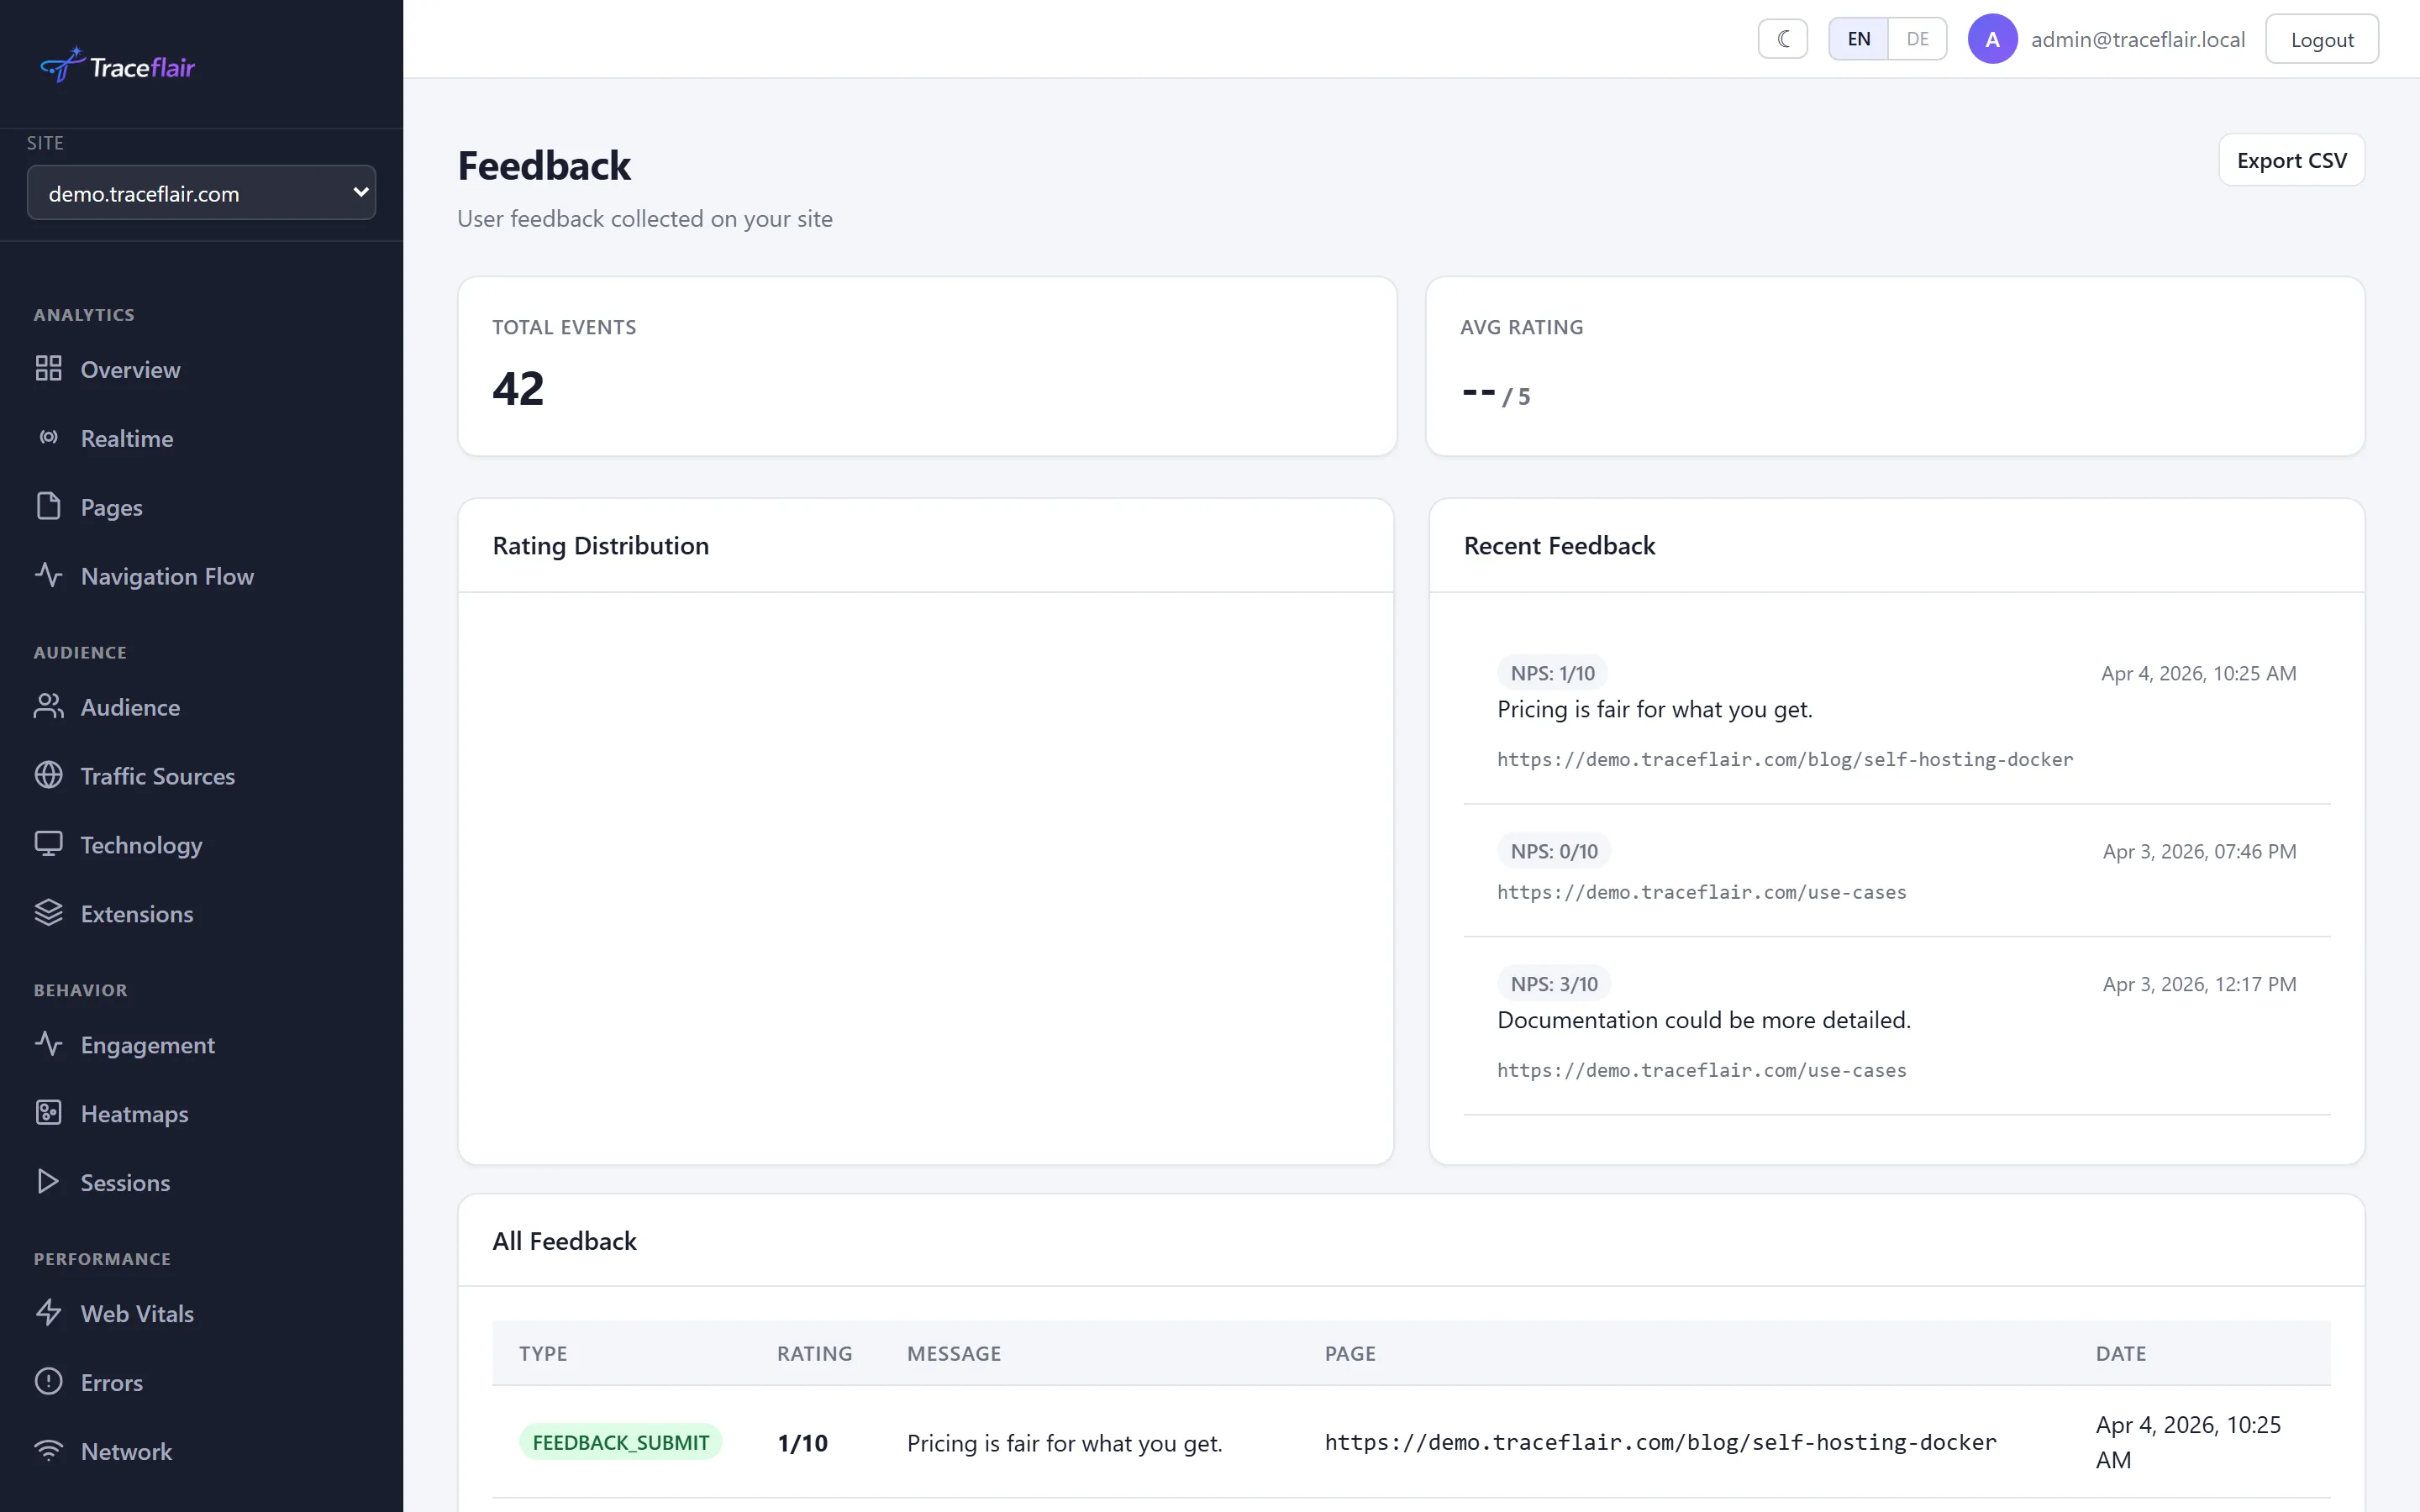
Feedback Widgets
Collect qualitative user feedback with customizable in-app widgets. Shadow DOM isolation ensures your widget styling never conflicts with your site.
- In-app feedback widget
- NPS and satisfaction surveys
- Shadow DOM isolation
- Targeted display rules
Privacy by Design
Three consent modes (opt-in, opt-out, implied), automatic PII detection, IP anonymization, and data-traceflair-ignore for sensitive DOM elements. GDPR-ready out of the box.
- 3 consent modes: opt-in, opt-out, implied
- Automatic PII detection & masking
- IP anonymization
- data-traceflair-ignore for sensitive areas
Plugin System
Only ship what you need. Every feature is a plugin — install the core (<3KB) and add capabilities one by one. Tree-shakeable, no bloat.
- Core SDK under 3KB gzipped
- Tree-shakeable plugin architecture
- Custom plugin API
- CDN bundle or npm packages
Bot Detection
Automatically filter out bot traffic, crawlers, and automated scripts. Keep your analytics clean and your event quotas accurate.
- User agent analysis
- Behavioral pattern detection
- Known bot signature filtering
Realtime Dashboard
See who's on your site right now. The realtime dashboard shows active visitors, current pages, and a live event stream — updated every 5 seconds. No more waiting for yesterday's data.
- Active session count in real time
- Events per minute tracking
- Current page distribution
- Auto-refresh every 5 seconds
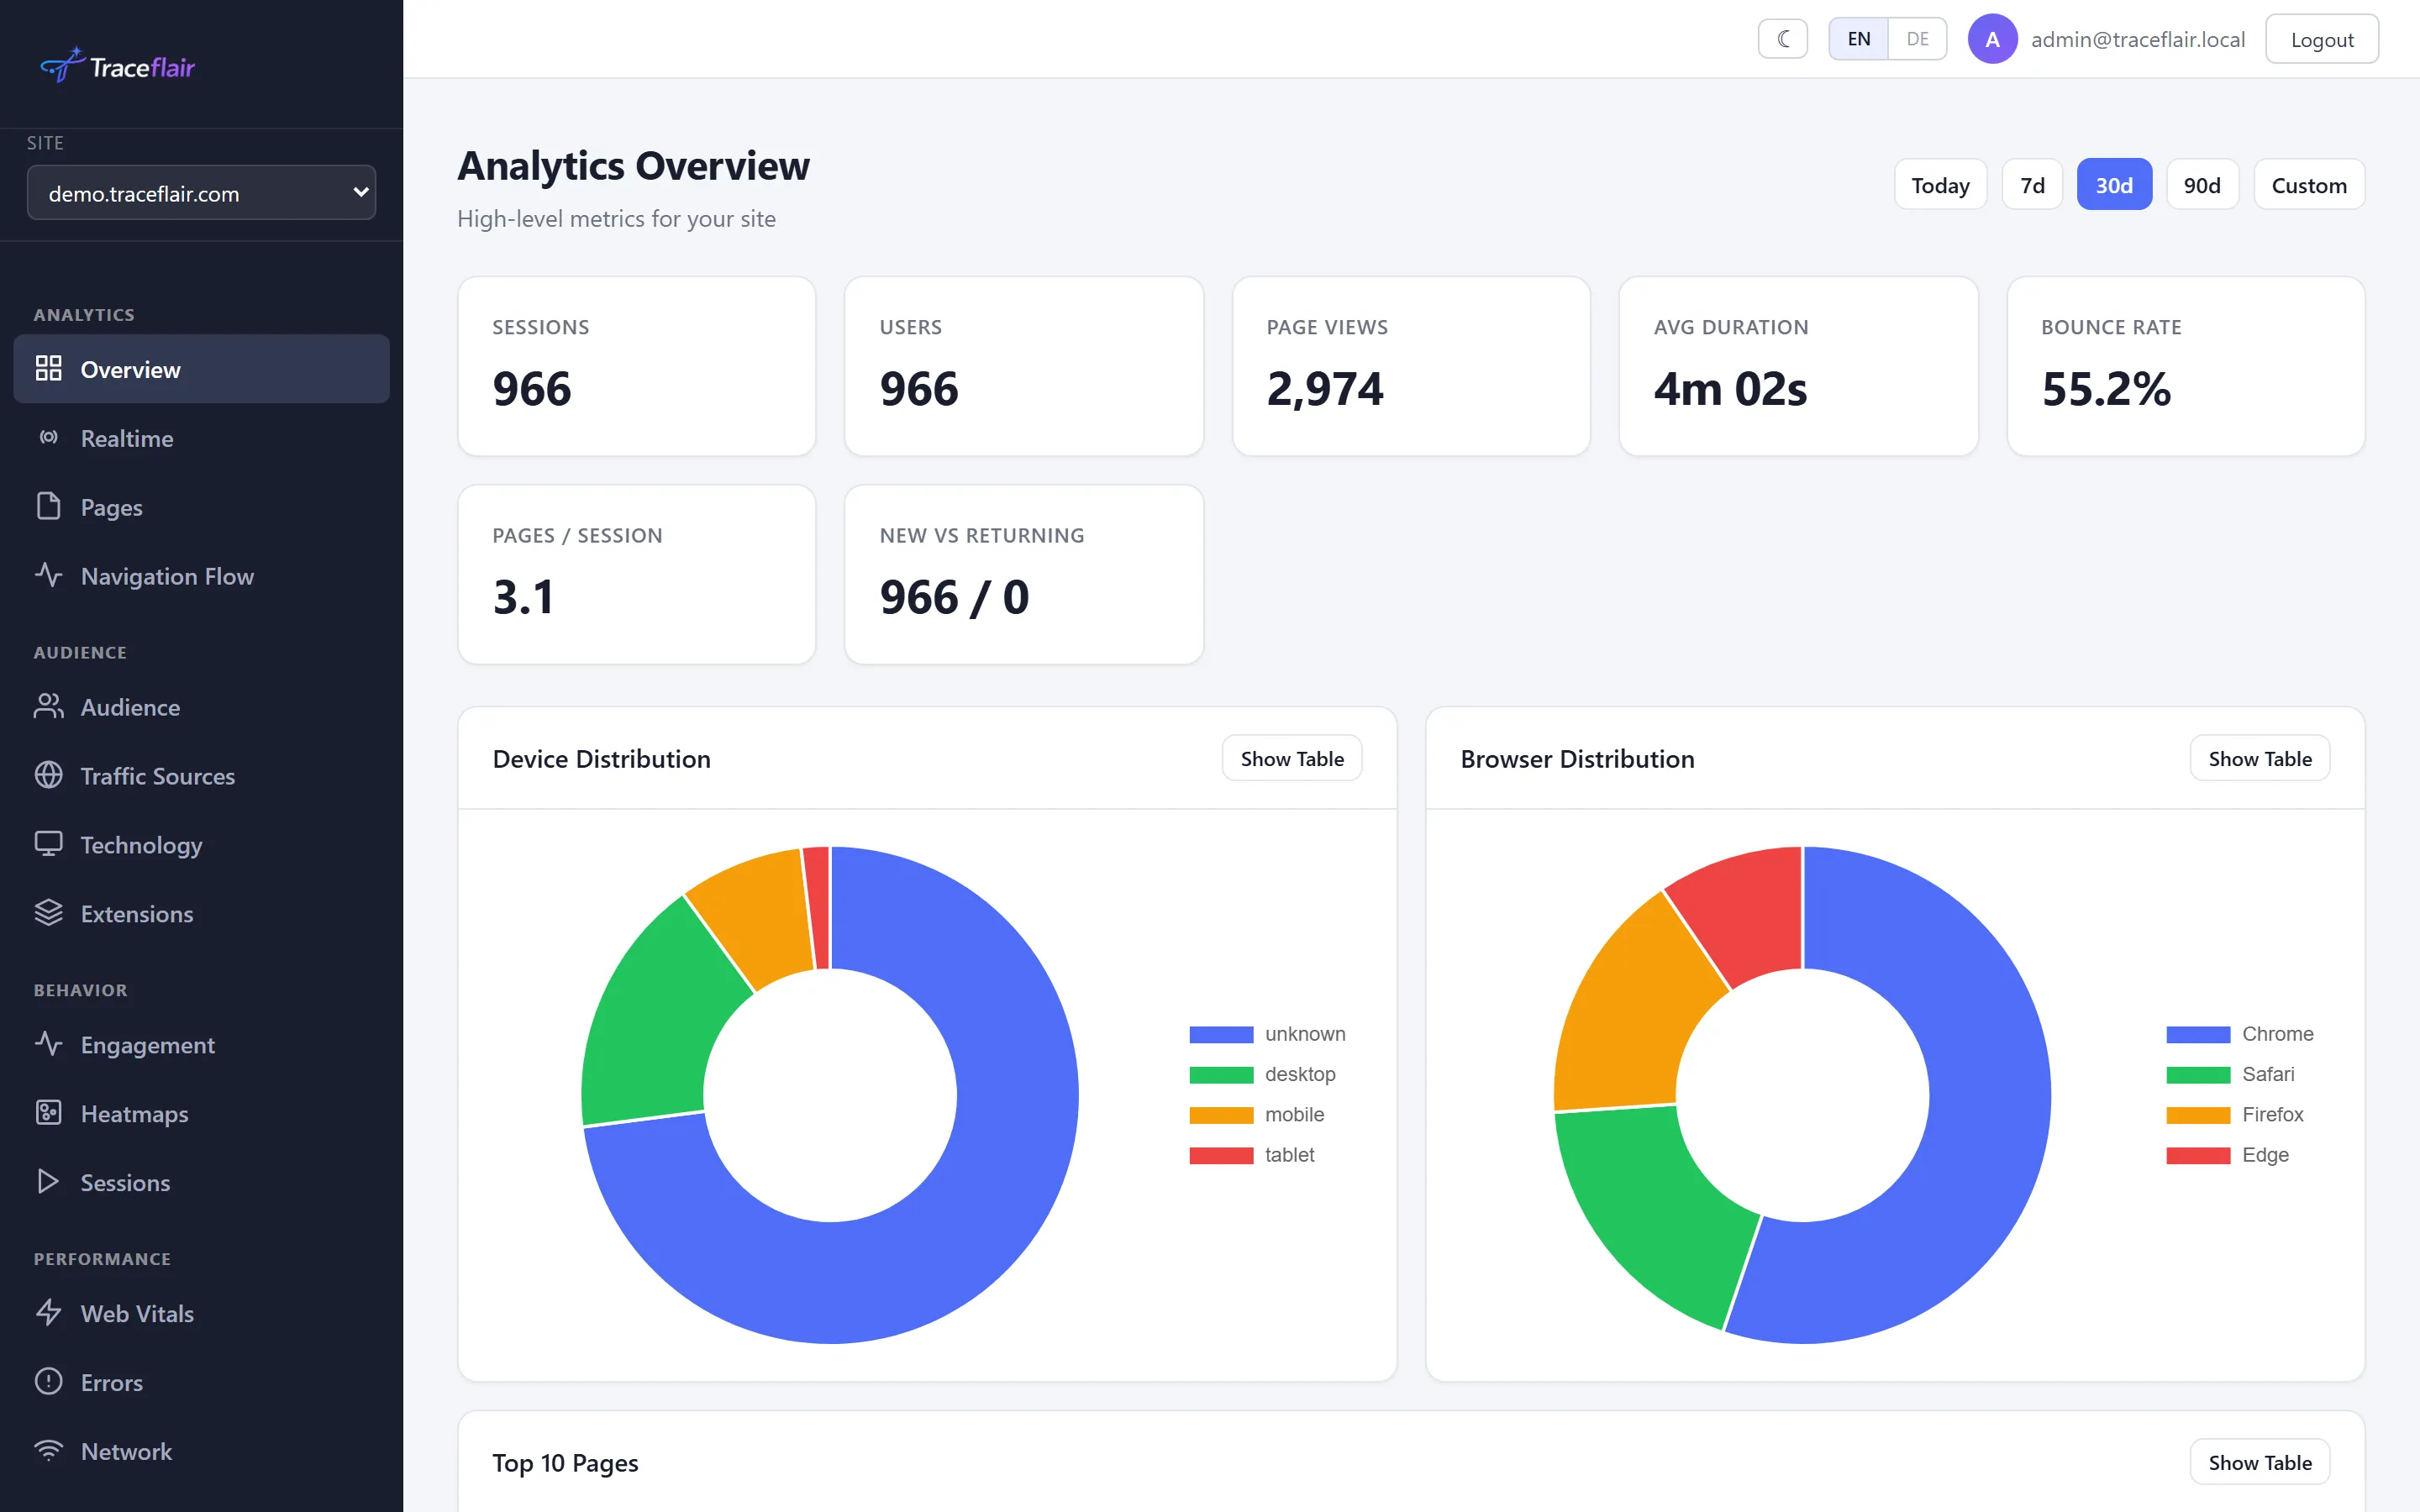
Traffic Sources
Know exactly where your visitors come from. Break down traffic by channel — organic, direct, referral, paid, social — and track UTM campaign performance down to the keyword level.
- Channel breakdown (organic, direct, referral, paid, social)
- Top referrer domains with session counts
- UTM campaign tracking (source, medium, campaign)
- Geographic visitor distribution
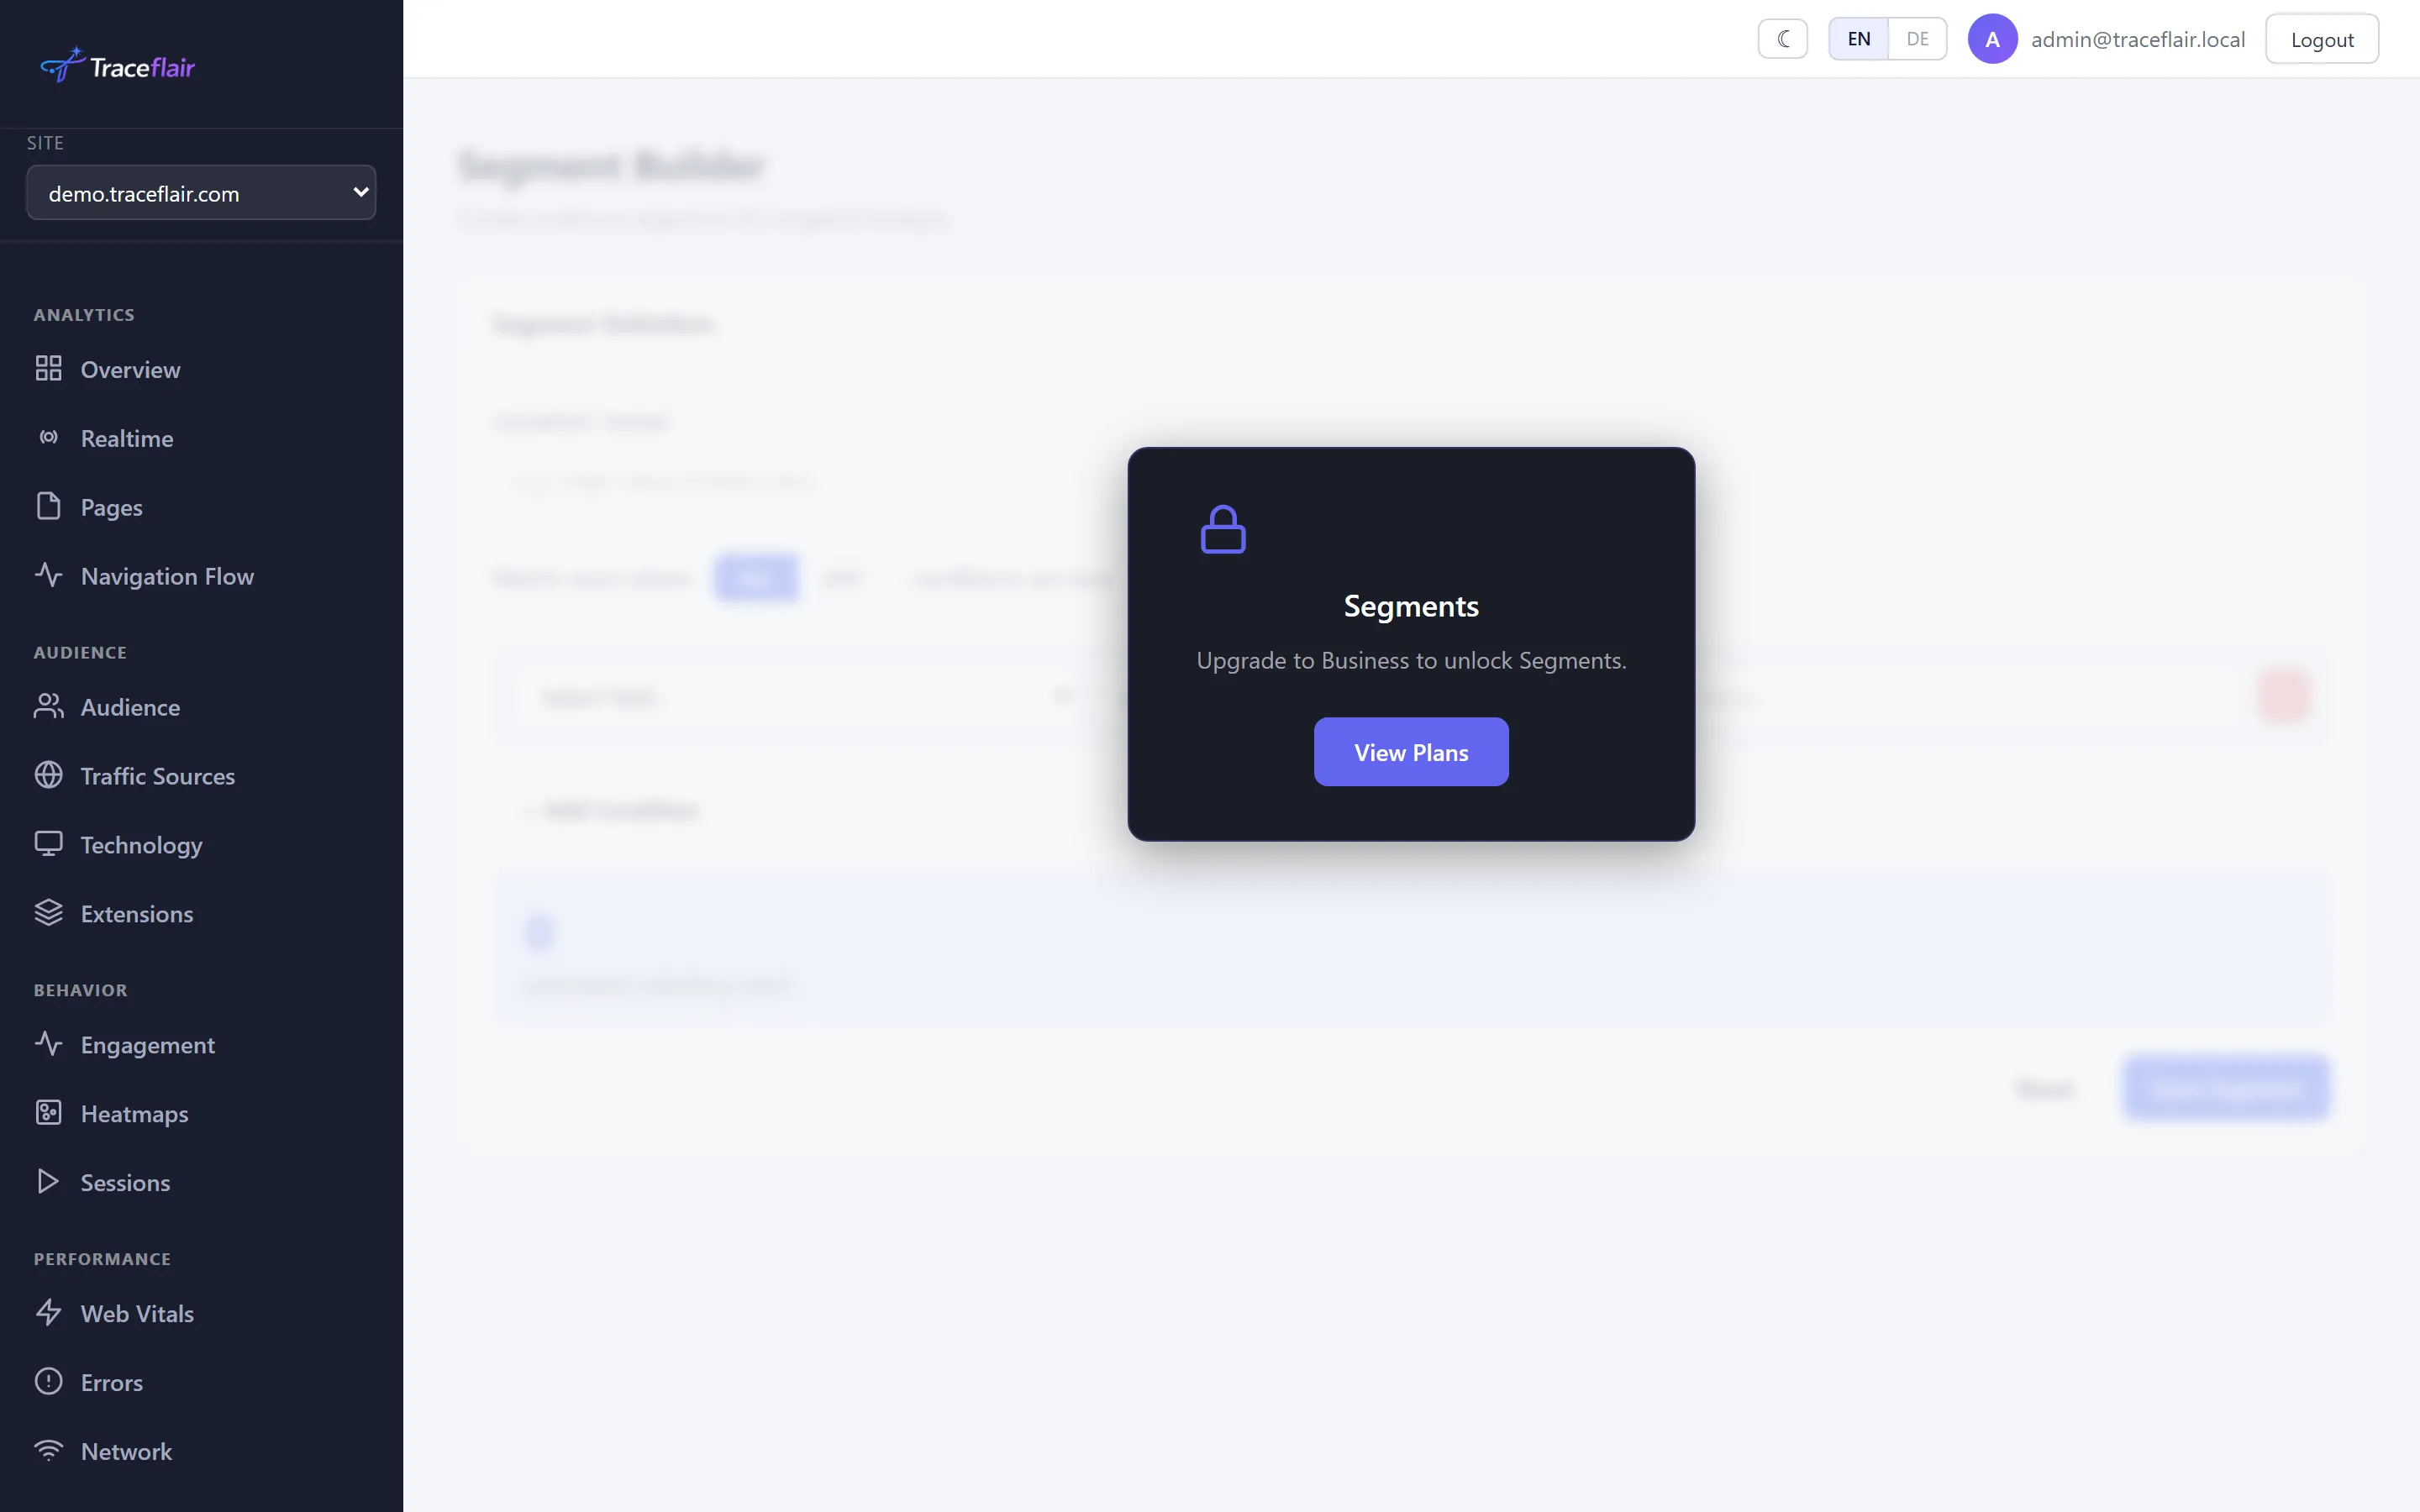
Segment Builder
Slice your data any way you want. Build custom audience segments using rules like country, device type, browser, referrer, page views, session duration, or any combination. See how different audiences behave.
- Rule-based segment creation
- AND/OR logic for combining conditions
- Device, country, browser, URL, event filters
- Estimated matching user count
Cohort Analysis
Group users by when they first visited and track how they behave over time. See week-over-week or month-over-month retention patterns and identify what drives long-term engagement.
- Weekly and monthly cohort granularity
- Retention matrix visualization
- Acquisition-based grouping
- Trend comparison across cohorts
Retention Analysis
How many users come back? Retention curves show you Day 1, Day 7, Day 14, and Day 30 return rates. Identify what keeps users engaged — and what causes them to churn.
- Day 1 through Day 30 retention rates
- Weekly and monthly retention views
- Retention curve visualization
- Compare retention across segments
Attribution
Which marketing channel actually drives revenue? Attribution models show you the full picture — from first touch to final conversion. Compare last click, first click, linear, and time decay models side by side.
- Last click attribution
- First click attribution
- Linear and time decay models
- Revenue and conversion attribution by channel
A/B Testing
Test changes before you commit. Set up experiments with traffic splitting, define conversion goals, and let Traceflair calculate statistical significance. Ship what works, kill what doesn't.
- Create experiments with multiple variants
- Configurable traffic split weights
- Goal event tracking per variant
- Statistical significance calculation
E-Commerce Analytics
Built for online stores. Track revenue, transactions, average order value, and cart abandonment rates. See the full shopping funnel from product view to payment confirmation.
- Revenue and transaction tracking
- Average order value and conversion rate
- Cart abandonment funnel
- Product-level performance metrics
Data Export
Your data belongs to you. Export events and sessions in CSV, JSON, or NDJSON format. Filter by date range. No vendor lock-in, no data hostage situations.
- Export as CSV, JSON, or NDJSON
- Events and sessions export
- Date range filtering
- Full data portability
Ad Cost Import
Bring your ad spend data into Traceflair. Import costs from Google Ads, Meta, LinkedIn, and other platforms. Calculate true ROAS and CPA across all your campaigns in one place.
- Import from Google Ads, Meta, LinkedIn
- Total spend, clicks, CPC, CTR metrics
- Platform and campaign breakdown
- True ROAS calculation
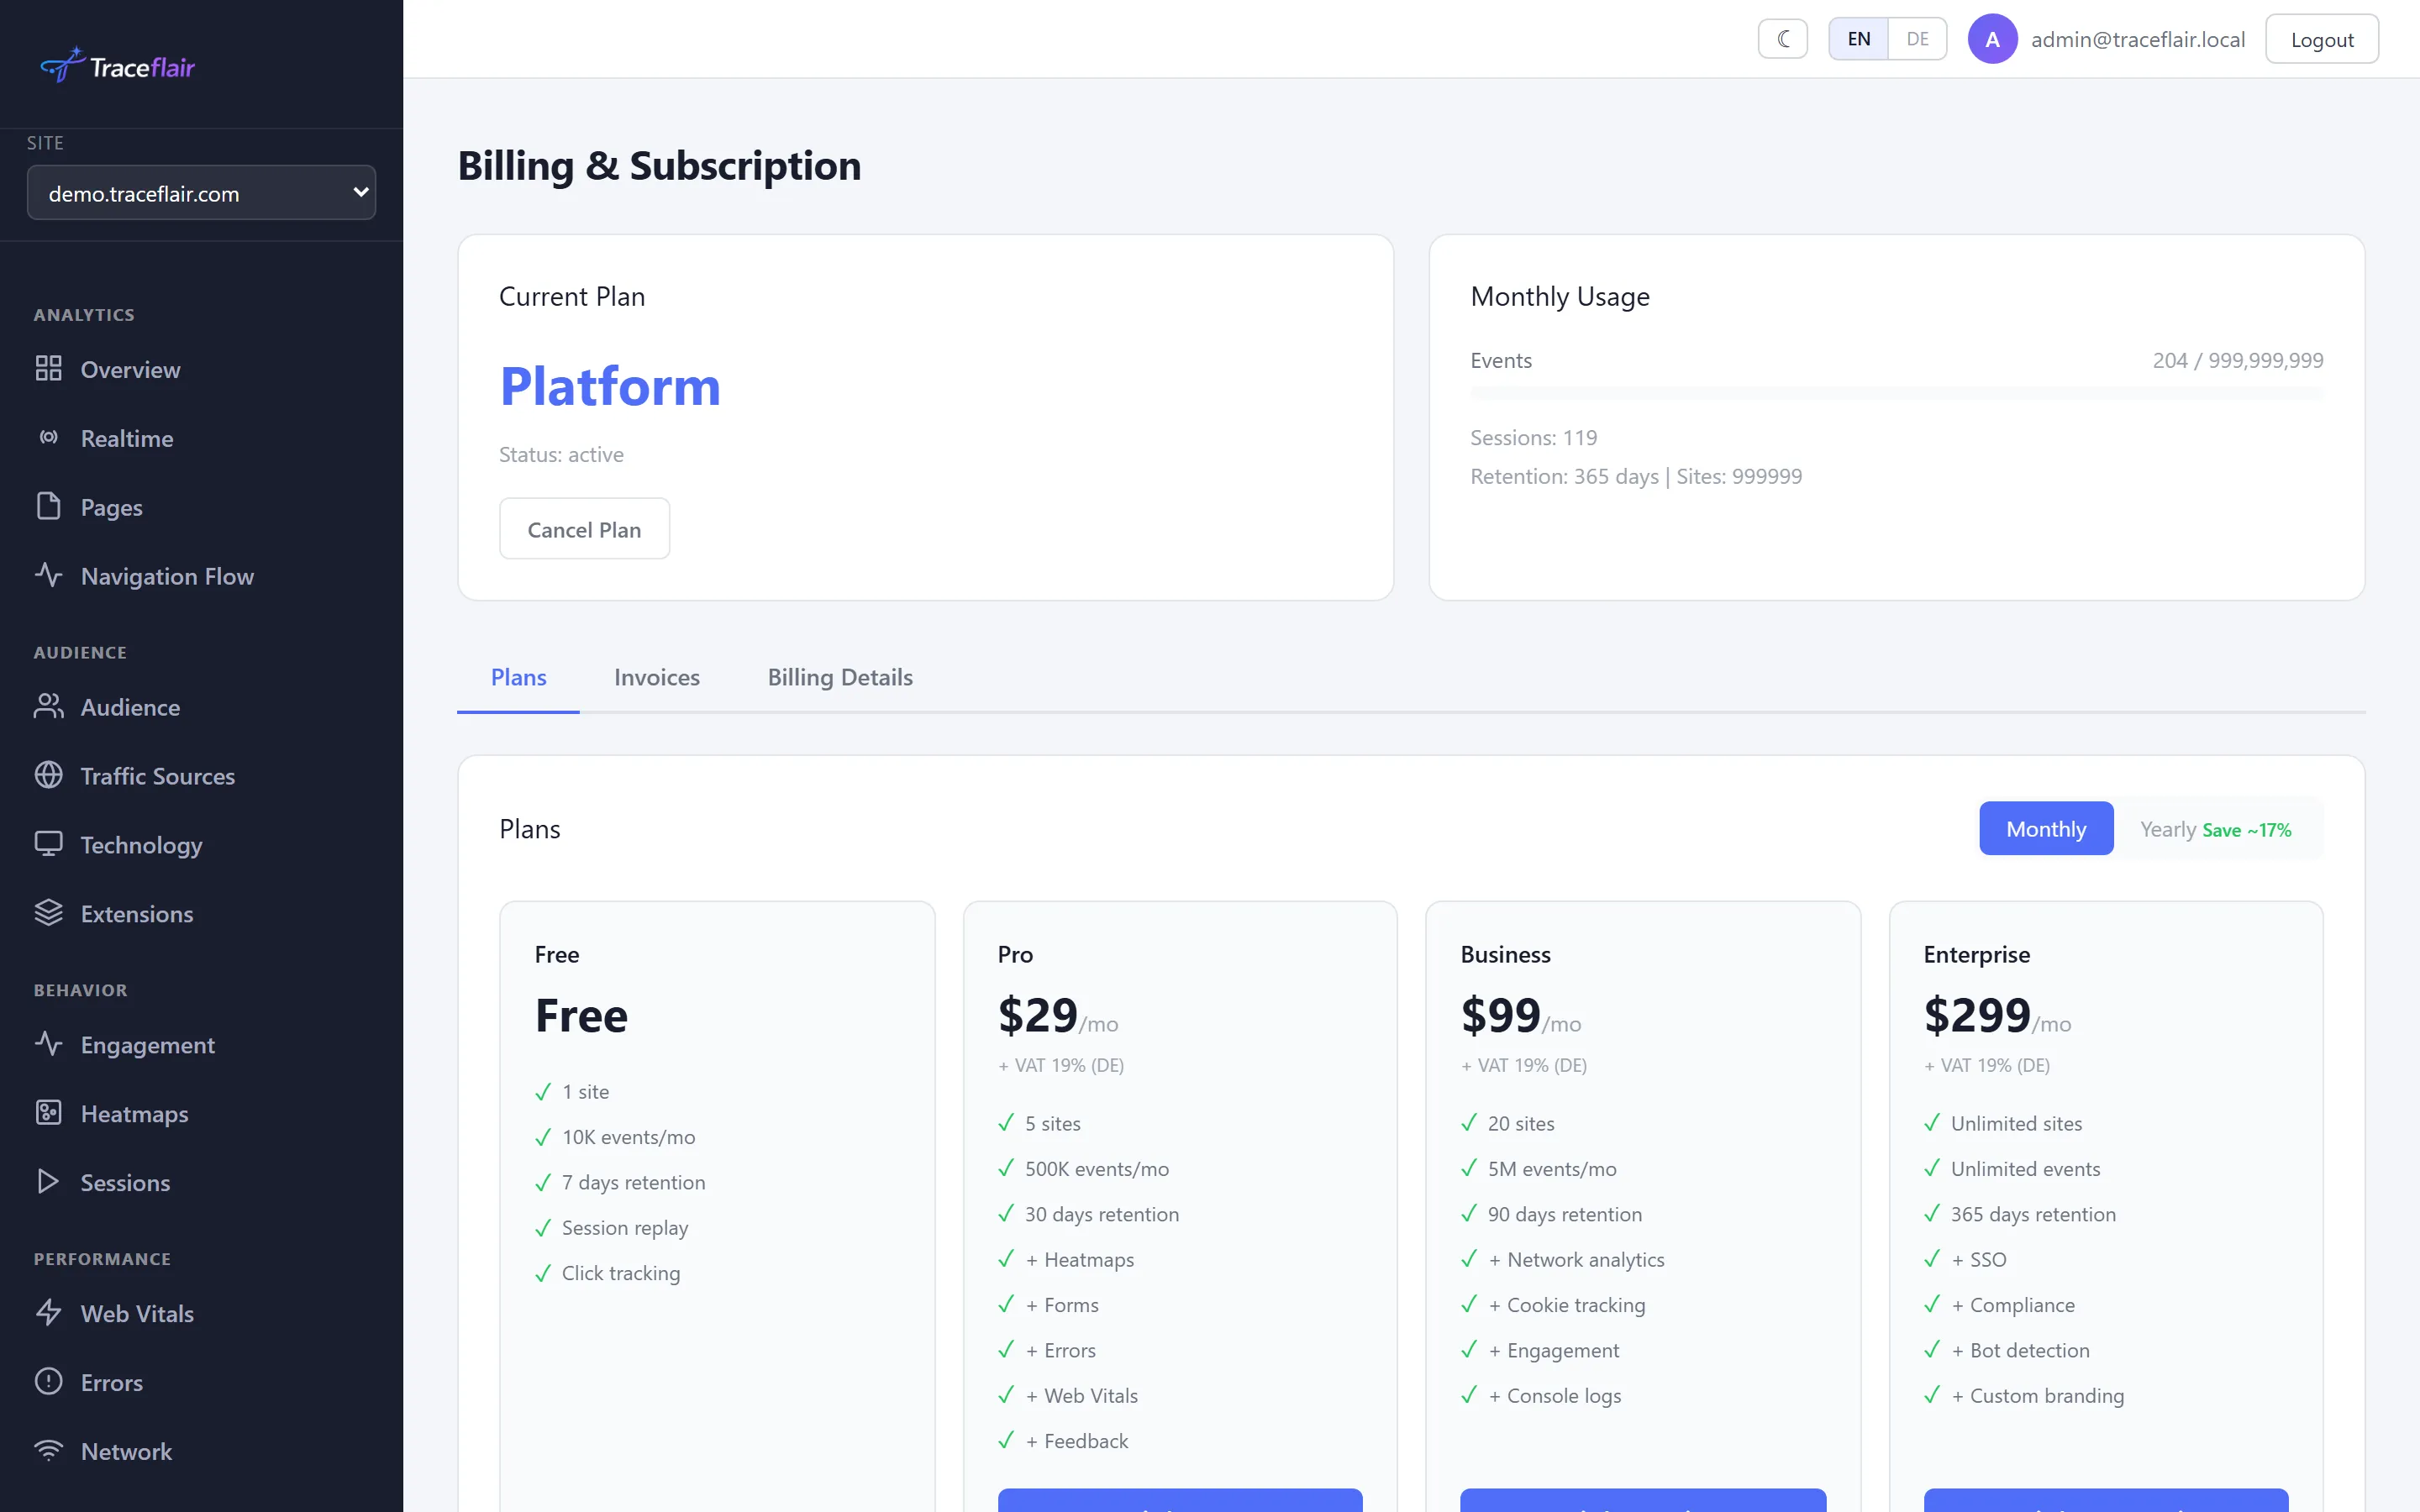
Engagement Analytics
Go beyond page views. Engagement analytics measures attention scores, detects rage clicks (users clicking furiously) and dead clicks (clicks on non-interactive elements). Understand how engaged your users really are.
- Attention score per page
- Rage click detection and analysis
- Dead click identification
- Engagement timeline visualization
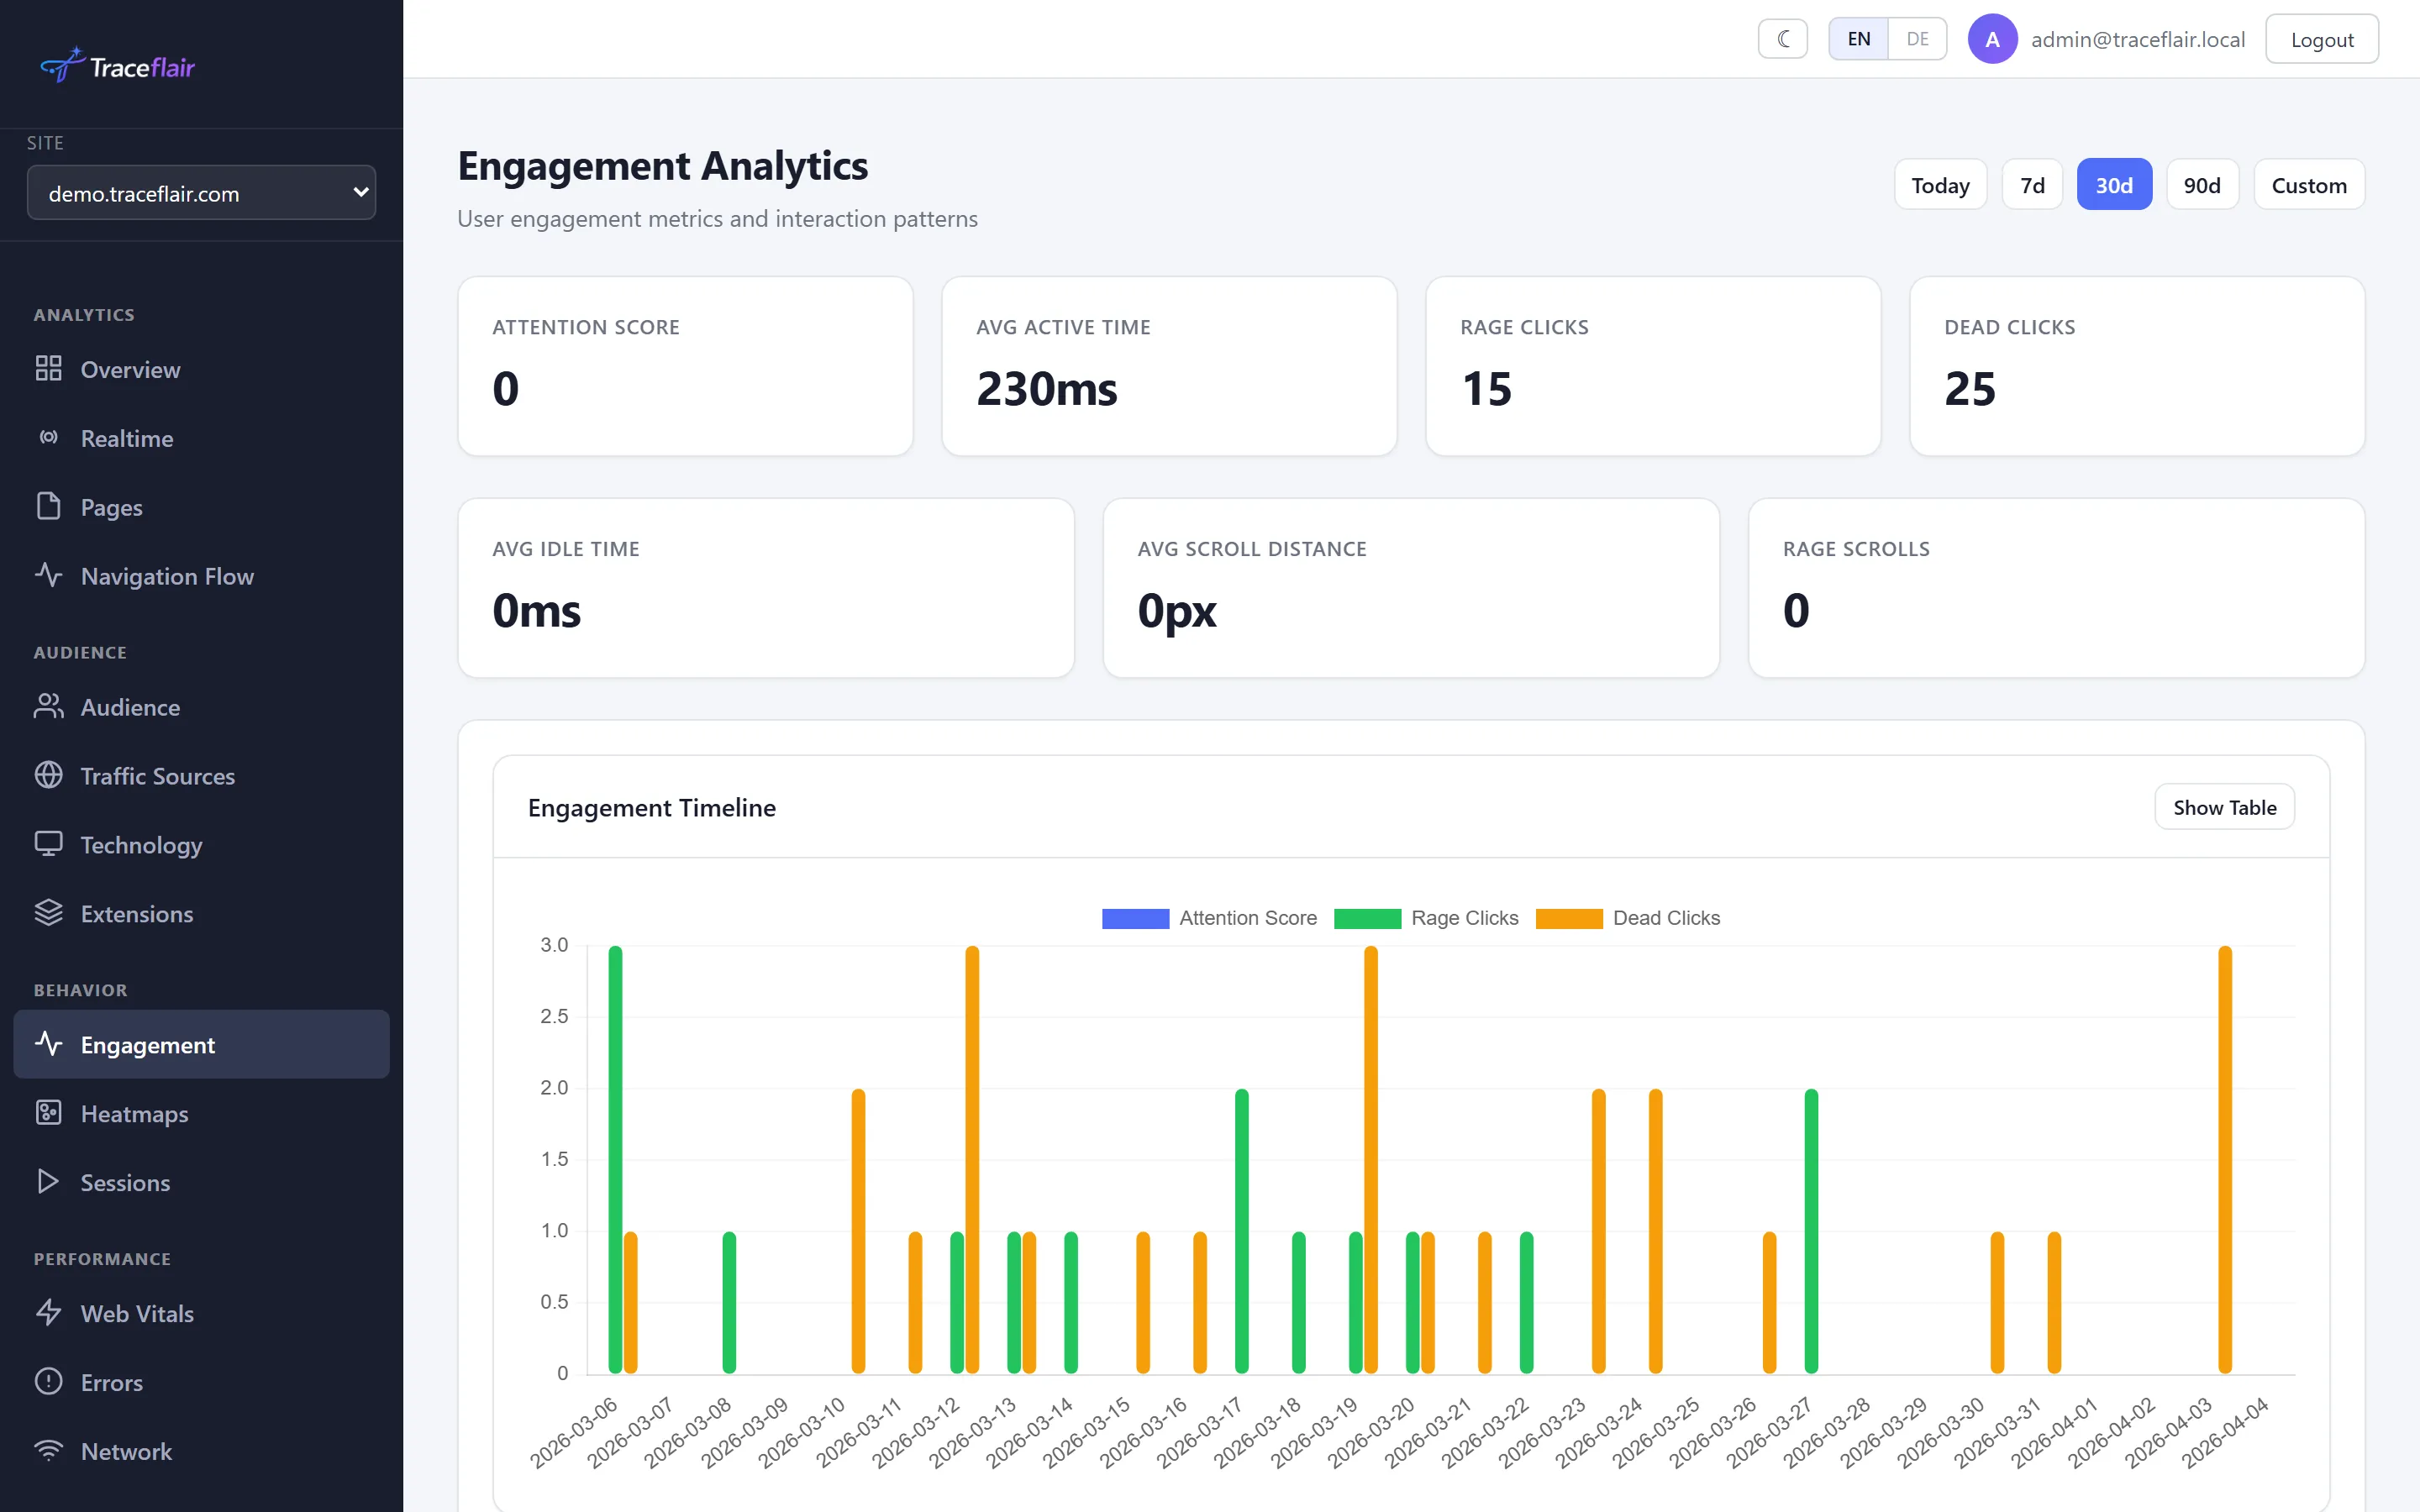
Network Analytics
Monitor your API endpoints from the user's perspective. Track response times, error rates, and request volume for every endpoint. Find slow APIs before they impact user experience.
- Response time per endpoint
- Error rate monitoring
- Request volume over time
- Endpoint performance ranking
Navigation Flow
Visualize how users move through your site. See page-to-page transitions, discover the most common user paths, and identify entry and exit points. Understand the real user journey — not the one you designed.
- Page transition visualization
- Top user path analysis
- Entry and exit point identification
- Flow data with percentages
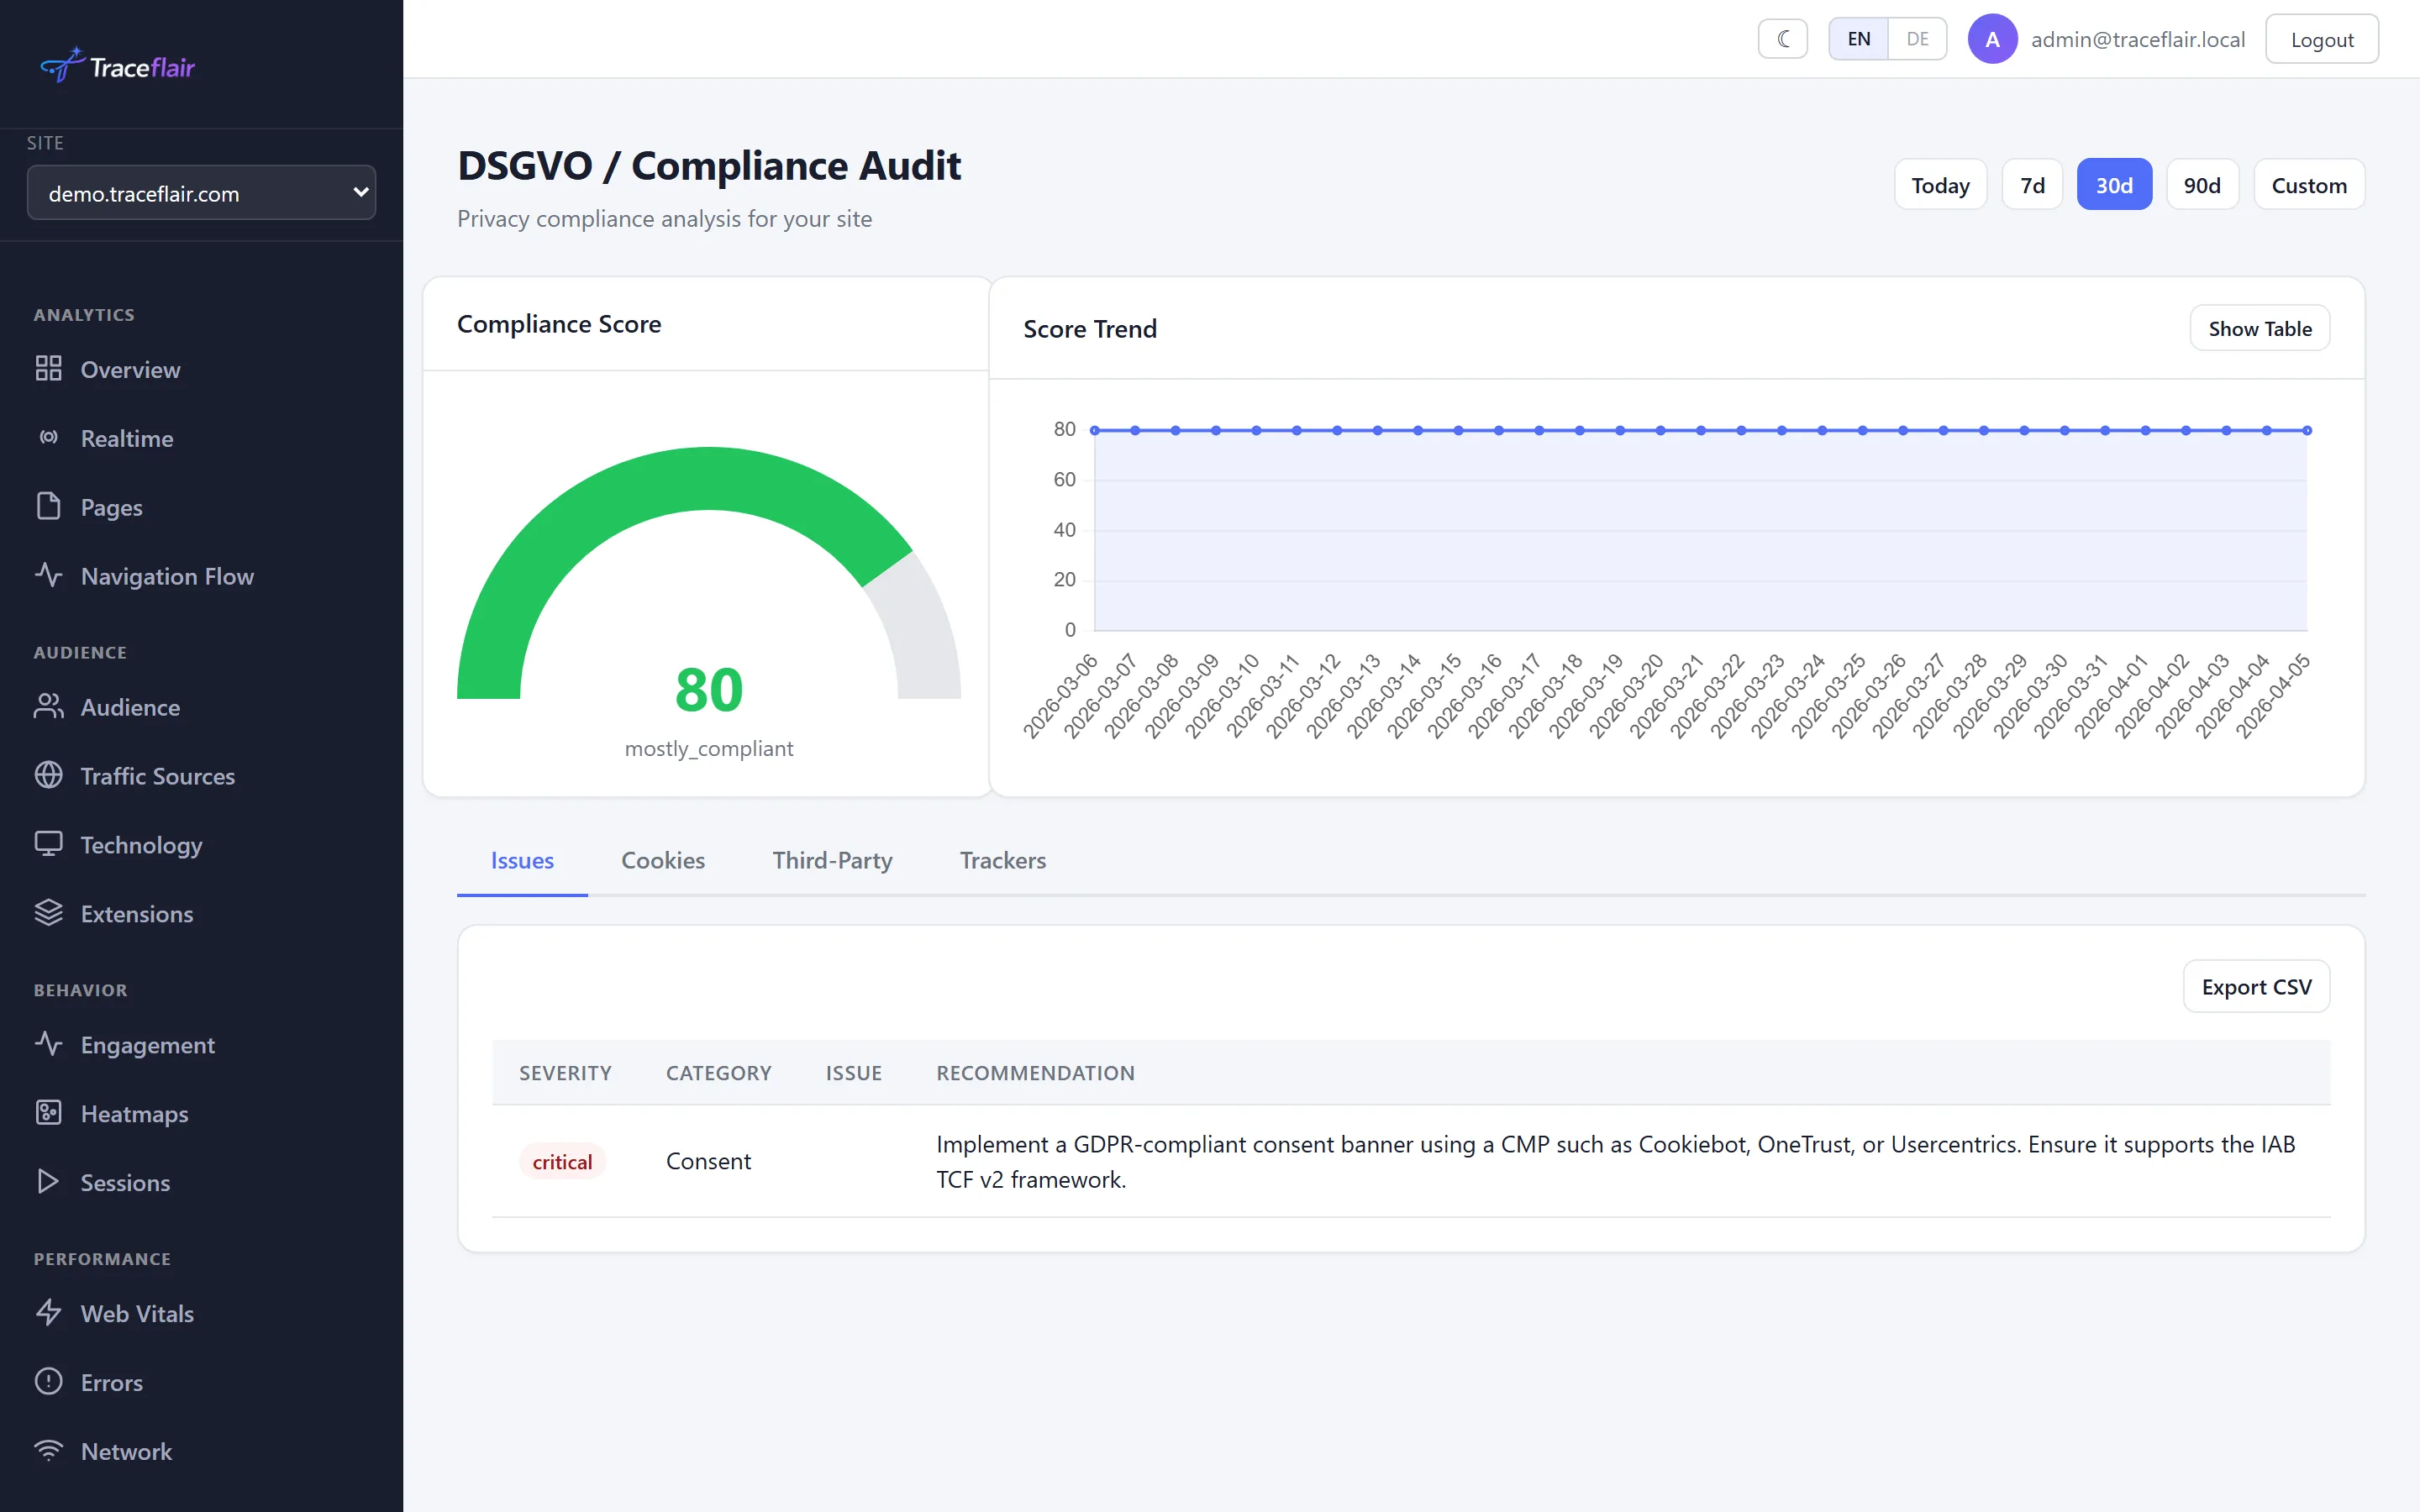
Compliance Dashboard
Stay ahead of GDPR and ePrivacy regulations. The compliance dashboard audits your site for privacy issues, tracks cookies and third-party scripts, detects unknown trackers, and maintains a compliance history.
- GDPR/ePrivacy compliance audit score
- Cookie categorization (essential, analytics, marketing)
- Third-party script detection
- Historical compliance trends
Technology Insights
Know your audience's technology stack. See browser distribution, operating system breakdown, device types, and screen resolutions. Optimize for the platforms your users actually use.
- Browser and version distribution
- Operating system breakdown
- Device type analysis (desktop, mobile, tablet)
- Screen resolution statistics
See what your users see. Fix what they struggle with.
Start your 14-day free trial in under 5 minutes. No credit card needed.
Start Your Free Trial Now